Image

Cross equatorial winds

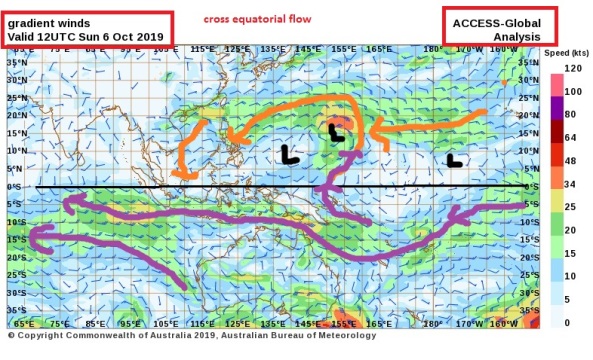
Winds don’t always stay in the same hemisphere . They do cross over in places across the equator 0 deg latitude.In both directions

I am starting this topic thread to investigate the flow of major wind streams from the Southern Hemisphere: SH and into the Northern hemisphere: NH   and vice versa ….in all seasons if l have the time.

I will capture the wind streams using ACCESS G model by BOM Australia

Greater Asia View because l am interested in the flow over Australia and across the equator

http://www.bom.gov.au/australia/charts/viewer/index.shtml?type=windbarb&level=gradient&tz=AEDT&area=DRSMC&model=G&chartSubmit=Refresh+View

Here is my first snap below. 8th September 2019. The first week of the Australian spring.

Notice how the winds from the southern cooler latitudes are conveyed up to the warmer northern mid , sub tropical and tropical latitudes.

You can see the importance of the high pressure cells , in particular the eastern flank, in transporting the cooler surface air to cool down the north latitudes.

The flow doesn’t stop here but continues into the NH in possible favorite more common spots along the equatorial line.

7th sept 2019 wind pattern asiaoz


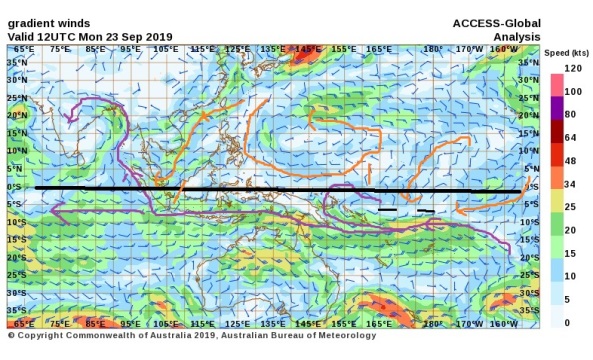
EQUINOX.. 23rd September 2019

There has been a significant change in direction of the NH wind streams this week. The major stream down past Korea  is on its way to the SH equator and some minor cross equatorial flow in the mid pacific atm

equinox 23rd sept 2019 wind asia


6thoct19 cross equatorial flow


Please go down to the comments section below for all further entries. Click on the heading to load if necessary.


Image

Climate shifts…natural variation

I have started this blog post because today l have found out all major search engines are re routing the search string ‘climate shift’.

If you enter this term into any search engine, it will respond with pages and pages of ‘climate change’

We are being prevented from viewing alternative theories to man made climate change theories or facts, folks.

I will make an attempt to collect some links to climate regime shift sites that focus on natural variability.

I have tried alternatives to google and they ALL redirect the term ‘climate shift’

…You can get around this by..

Using google scholar…

which will accept the string ‘climate shift’ and lead you to alternative research on the reasons for global temperature trends other than AGW

or

on on the main google search engine page use talking marks on the search string which over rides the ban on the term… climate shift

“climate shift”


Image

Troposphere height

Links , pictures, research, information.

troposphere rheemoclineatmosphere temperature layers with,height

In no specific order.

Theory. Height of the troposphere

http://www-das.uwyo.edu/~geerts/cwx/notes/chap01/tropo.html

extract

‘The height of the tropopause depends on the location, notably the latitude, as shown in the figure on the right (which shows annual mean conditions). It also depends on the season (1, 2). Thus, it is about 16 km high over Australia at year-end, and between 12 – 16 km at midyear, being lower at the higher latitudes. At latitudes above 60� , the tropopause is less than 9 -10 km above sea level; the lowest is less than 8 km high, above Antarctica and above Siberia and northern Canada in winter. The highest average tropopause is over the oceanic warm pool of the western equatorial Pacific, about 17.5 km high, and over Southeast Asia, during the summer monsoon, the tropopause occasionally peaks above 18 km. In other words, cold conditions lead to a lower tropopause, obviously because of less convection.

Deep convection (thunderstorms) in the Intertropical Convergence Zone, or over mid-latitude continents in summer, continuously push the tropopause upwards and as such deepen the troposphere. This is because thunderstorms mix the tropospheric air at a moist adiabatic lapse rate. In the upper troposphere, this lapse rate is essentially the same as the dry adiabatic rate of 10K/km. So a deepening by 1 km reduces the tropopause temperature by 10K. Therefore, in areas where (or at times when) the tropopause is exceptionally high, the tropopause temperature is also very low, sometimes below -80� C. Such low temperatures are not found anywhere else in the Earth’s atmosphere, at any level, except in the winter stratosphere over Antarctica.

On the other hand, colder regions have a lower tropopause, obviously because convective overturning is limited there, due to the negative radiation balance at the surface. In fact, convection is very rare in polar regions; most of the tropospheric mixing at middle and high latitudes is forced by frontal systems in which uplift is forced rather than spontaneous (convective). This explains the paradox that tropopause temperatures are lowest where the surface temperatures are highest.

The tropopause height does not gradually drop from low to high latitudes. Rather, it drops rapidly in the area of the subtropical and polar front jets (STJ and PFJ respectively in the Figure on the left), as shown in the Palmen-Newton model of the general circulation (Fig 12.16 or Fig on left). Especially when the jet is strong and the associated front at low levels intense, then the tropopause height drops suddenly across the jet stream. Sometimes the tropopause actually folds down to 500 hPa (5.5 km) and even lower, just behind a well-defined cold front. The subsided stratospheric air within such a tropopause fold (or in the less pronounced tropopause dip) is much warmer than the tropospheric air it replaces, at the same level, and this warm advection aloft (around 300 hPa) largely explains the movement of the frontal low (at the surface) into the cold airmass, a process called occlusion (Section 13.3) (4).


………

Google search.. ‘pictures tropopause height’

https://www.google.com/search?q=picture+tropopause+height&tbm=isch&source=univ&client=firefox-b-d&sa=X&ved=2ahUKEwjlnsDf-bDjAhVDfX0KHcEUAu0QsAR6BAgEEAE&biw=1025&bih=491

………..


Image

Atmospheric Global Circulation Patterns ..Knowledge bank

SURFACE WINDS .. JANUARY PATTERN

jan global wind patterns

SURFACE WINDS..JULY GENERAL PATTERN

july global wind patterns

Thanks to…SOURCE LINK. LECTURES
http://www.st-andrews.ac.uk/~dib2/GE1001/atmosphere2.html

——————————–

Thanks to ‘Bucketingdown’ from weatherzone
http://forum.weatherzone.com.au/ubbthreads.php/topics/1229988/Re_ENSO_Discussion_2014#Post1229988
for this nice theoretical web page on the wind systems of our globe

I will add more links as l find them in the comment section below
You may need to click on the title of this post to enter comments section or scroll down
Feel free to add more links in the comments section below