I have started compiling an list of climate variables that are crucial for observing a period of global cooling..
ONGOING POSTS IN COMMENTS SECTION
Follow comments for upcoming additions
Lets start with
THE SUN

A good article here outlining how our SUN is behaving uo to JULY 2013
Solar Cycle #24: On Track to be the Weakest in 100 Years
by David Dickinson on July 29, 2013
“Not only is this the smallest cycle we’ve seen in the space age, it’s the smallest cycle in 100 years,” NASA/Marshall Space Flight Center research scientist David Hathaway said during a recent press teleconference conducted by the Marshall Space Flight Center.
Also of interest from this article
So far, several theories have been put forth as to why our tempestuous star seems to be straying from its usual self. Along with the standard 11-year cycle, it’s thought that there may be a longer, 100 year trend of activity and subsidence known as the Gleissberg Cycle.
GLEISSBURG CYCLE
…. A good reference here..
http://solarphysics.livingreviews.org/open?pubNo=lrsp-2010-1&page=articlesu25.html
From that link above l have posted the cycle below
Notice the Gleissburg cycle is on a downward phase currently and has been trending that way since Solar cycle 20 which peaked maximum around close to 1970.
By the looks of this diagram below we might expect the Gleissburg cycle to bottom out at around roughly 2014..
Global temperatures have risen while the Gleissburg cycle has been trending down..??
Before discounting solar here. One much consider the lag time associated with these larger cycles.
Global cooling commenced in 2006.
If lag was an issue here. Then the peak of Gleissburg cycle in ~1970 to the point at which global temperatures have started to fall in 2006 is
2006 – 1970 = 36yrs?
This global downturn may be amplified by the next downward phase of the 11 yr solar cycle from 2014 to about 2020.
Could be an interesting time to study the sun and earths climate

—————————————————————
—————————————————————
AN EXPECTED PERIOD OF NEGATIVE ARCTIC OSCILLATION ANOMALY
is considered an indicator of a likely cooler period for some parts of the Northern Hemisphere
A Diagram and explanation from NSIDC ………..http://nsidc.org/showing how a positive and negative AO index affects the Northern hemisphere atmospheric circulation patterns and ultimately the weather patterns

Some links and resources posted below to watch this index in the years ahead. I would imagine we would expect to see this index to be more frequently in the negative range for global cooling to occur
“The Arctic Oscillation refers to opposing atmospheric pressure patterns in northern middle and high latitudes.
The oscillation exhibits a “negative phase” with relatively high pressure over the polar region and low pressure at midlatitudes (about 45 degrees North), and a “positive phase” in which the pattern is reversed.
In the positive phase, higher pressure at midlatitudes drives ocean storms farther north, and changes in the circulation pattern bring wetter weather to Alaska, Scotland and Scandinavia, as well as drier conditions to the western United States and the Mediterranean.
In the positive phase, frigid winter air does not extend as far into the middle of North America as it would during the negative phase of the oscillation. This keeps much of the United States east of the Rocky Mountains warmer than normal, but leaves Greenland and Newfoundland colder than usual. Weather patterns in the negative phase are in general “opposite” to those of the positive phase
Over most of the past century, the Arctic Oscillation alternated between its positive and negative phases. Starting in the 1970s, however, the oscillation has tended to stay in the positive phase, causing lower than normal arctic air pressure and higher than normal temperatures in much of the United States and northern Eurasia.”
TIME SERIES
————————–
1950 — to this current month
http://www.cpc.ncep.noaa.gov/products/precip/CWlink/daily_ao_index/month_ao_index.shtml
CURRENT DAILY INDEX
———————————————
NOAA site
http://www.cpc.ncep.noaa.gov/products/precip/CWlink/daily_ao_index/ao_index.html
GRAPH
MONTHLY VALUES … 1955 until THIS MONTH
—————————————————————-
FURTHER BACK.. RECONSTRUCTIONS..1658 – 1900
Luterbacher et al …..2002. Extending North Atlantic Oscillation
Reconstructions Back to 1500.
and
from December 1900 to July 2001
are derived from Trenberth and Paolino (1980)
Not sure how reliable this long term reconstruction of the AO is here
It goes back to 1658 to 2001 and gives monthly anomalies
I am always wary of ‘reconstructions’
but here it is
ftp://ftp.ncdc.noaa.gov/pub/data/paleo/historical/north_atlantic/nao_mon.txt
—————————————————————————————————-

TRACKING the NORTHERN HEMISPHERE SNOW LINE
————————————————-
The best forum discussion l have seen for this is here
THIS SEASONS THREAD has commenced
Snow and Ice in the Northern Hemisphere 2013/14
http://forum.netweather.tv/topic/77585-snow-and-ice-in-the-northern-hemisphere-201314/
———————————————————————
WEB CAM of
http://longyearbyen.livecam360.com/flash/main.php
watch the snow arrive..and leave
Spitsbergen (formerly known as West Spitsbergen; Norwegian: Vest Spitsbergen or Vestspitsbergen)[1][2][3] is the largest and only permanently populated island of the Svalbard archipelago in Norway
http://en.wikipedia.org/wiki/Spitsbergen
http://en.wikipedia.org/wiki/Longyearbyen
WEB CAM
BARROW.. On the coast of ALASKA
http://seaice.alaska.edu/gi/observatories/barrow_webcam
—————————————
TIME SERIES GRAPHS and MAPS of NORTHERN HEMISPHERE SNOWLINE
http://moe.met.fsu.edu/snow/
———————————————–
BLOG
DOSBAT
Notes from an amateur reader of Arctic sea ice science.
http://dosbat.blogspot.nl/2011/10/cold-winters-siberian-snowfall.html
TRACKING the ARCTIC ICE EXTENT
—————————————————–
Some good news up to 21st August 2013
“2nd slowest ice melt season on record just behind 2001”
by Stewfox …From this forum thread.
http://forum.netweather.tv/topic/76273-arctic-ice-discussion-2013-melt-season/page-29
There is always an interesting and informative discussion going on in this thread
. The AGW ‘front men’ and the AGW sceptical crowd at loggerheads debating the current trends and conditions
I recommend this forum thread as an amusing yet informative way to keep track of the ARTIC ICE EXTENT TRENDS
——————————————————————-
SOME EXPERT LINKS
Anthony WATTS from WUWT wordpress has an extensive listing of resources for watching Arctic ice extent
Why invent the wheel
Here is his compendium
Quite a good video from the BBC presenter here comparing the 2012 and 2013 ARCTIC ICE MELT season
Tracking the Arctic sea ice
http://www.bbc.co.uk/weather/feeds/23904997
A report on the present sunspot cycle from NASA…
“We are currently over four years into Cycle 24. The current predicted and observed size makes this the smallest sunspot cycle since Cycle 14 which had a maximum of 64.2 in February of 1906. ”
The remainder of the article discusses the various techniques used to forecast or estimate the future sunspot cycle
http://solarscience.msfc.nasa.gov/predict.shtml
Central England Annual Mean Temperature ( CET) Plunges 1°C Since 2000
Hmmm. That’s a rate of 1 deg C/ decade or 10 deg /century !!!
LOL
Isn’t that how the IPCC calculate temperature trends?
So that’s a parallel analogy
source
A comprehensive report by Pierre Gossellin
http://notrickszone.com/2013/09/12/no-warming-left-to-deny-global-cooling-takes-over-cet-annual-mean-temperature-plunges-1c-since-2000/
GLOBAL TEMPERATURES HAVE DECLINED SINCE 2005
source
http://www.woodfortrees.org/
ARCTIC TEMPERATURE ANOMALY ….2013
Daily mean temperature and climate north of the 80th northern parallel, as a function of the day of year.
source
DMI
Centre for snow and ice
http://ocean.dmi.dk/arctic/meant80n.uk.php
DMI : Home page
http://ocean.dmi.dk/english/index.php
Another Nice image
Map of the CURRENT DAILY ARCTIC ICE EXTENT.
This image is hot-linked and will update
source:

EXCELLENT RESOURCE HERE
SNOW EXTENT ANOMALIES FOR EACH MONTH..CURRENT
NORTHERN HEMISPHERE
EURASIA
CANADA
NORTH AMERICA
USA
ALASKA
Link
http://climate.rutgers.edu/snowcover/table_rankings.php?ui_set=1
SAMPLE
SEPTEMBER 2013
6th highest snow extent out of 45 years of records in the Northern hemisphere
SOME EXCELLENT INCREASES IN ARCTIC ICE EXTENT SEPTEMBER 2013
RETURNED TO 2006 ANOMALIES
CURRENT ARCTIC SEA ICE EXTENT ANOMALY…DMI centre for Ocean and Ice
source
http://ocean.dmi.dk/arctic/old_icecover.uk.php
Antarctic Ice Sets New All Time Record In October 2013
October 19, 2013
source
Antarctic Ice Sets New All Time Record In October 2013
October 19, 2013
source
Professor LOCKWOOD.
Reading University ..in the UK
Following analysis of the data,
Professor Lockwood believes solar activity is now falling more rapidly than at any time in the last 10,000 years.
Professor Lockwood found 24 different occasions in the last 10,000 years when the sun was in exactly the same state as it is now – and the present decline is faster than any of those 24.
Based on his findings he’s raised the risk of a new Maunder minimum from less than 10% just a few years ago to 25-30%.
And a repeat of the Dalton solar minimum which occurred in the early 1800s, which also had its fair share of cold winters and poor summers, is, according to him, ‘more likely than not’ to happen.
http://www.live.bbc.co.uk/blogs/blogpaulhudson/posts/Real-risk-of-a-Maunder-minimum-Little-Ice-Age-says-leading-scientist
GLOBAL SEA ICE COVER STILL INCREASING
<
source
https://stevengoddard.files.wordpress.com/2013/12/
http://forum.netweather.tv/topic/76448-scepticism-of-man-made-climate-change/page-47
Jan 19th 2014
An article about our current quiet SUN AT SOLAR MAXIMUM
http://www.adelaidenow.com.au/technology/science/scientists-baffled-as-sun-activity-falls-to-century-low/story-fnjwlbug-1226805090679
source
STEVE GODDARD TWEETED
In a sure sign of Mann-made CO2 doom, global sea ice area is right at the 30 year mean.
http://arctic.atmos.uiuc.edu/cryosphere/iphone/images/iphone.anomaly.global.png … pic.twitter.com/2c6PErl4H5
Thank God the global ice extent has increased above average


Historic ice coverage of the Great lakes for April 2014..!! EPIC ANOMALY
extract from Brett Anderson from ACCUWEATHER blog
“the graph below from the Canadian Ice Service clearly shows that the current ice coverage is way above the normal (green line), which is 3 percent for this particular week.”
The second highest since the beginning of the satellite measured era (1980) is much lower at 18 percent back in 1996.
JESSE FERREL’s report on record highs and record lows globally and for the US
For year to date Jan -April 2014
and the past 365 days
BOOKMARK this ACCUWEATHER BLOGGER…’weathermatrix’
He is a GEM !!
http://www.accuweather.com/en/weather-blogs/weathermatrix/are-global-cold-records-overtaking-warm/24662335
Read on .. His results will rattle you
http://vortex.accuweather.com/adc2004/pub/includes/columns/community/2014/
——————–
some snippets
Here are the takeaways:
– More daily record lows than highs in the U.S. so far in 2014, and the last 365 days.
– More daily record lows than highs worldwide during 2014.
– During last 365 days, globally, highs have a slight advantage — 53% to 47% (a close race).
There have been the same number of monthly record lows and highs broken across the globe in the last year!
This is interesting because, since the 1980s, record highs have far outnumbered record lows (at least daily records, on a decadal basis)
GEOFF SHARP ..TWEETED
ANTARTIC SEA ICE EXTENT

http://nsidc.org/data/seaice_index/images/daily_images/
Thanks to Tallbloke blog for posting this link
http://notrickszone.com/2014/05/27/warming-scientists-humiliated-strong-cooling-seizes-european-alps-considerably-colder-winters-since-198889/
http://www.zukunft-skisport.at/these-2-die-winter-werden-seit-26-jahren-kaelter/
Figure 1 at their site shows winter temperatures at the Hahnenkamm station at Kitzbühel (1790 m).
Clearly the trend here is dramatic cooling (7.5°C per century) taking place over the last 20 years! Moreover 8 of the coldest winters occurred in the last 11 years alone.
Figure 2 shows the development of winter temperatures at the Ostalpen (East Alps) summit since 1970/71. The chart is the average of three stations: Säntis, Zugspitze and Sonnblick.
Here as well the trend since 1988 is sharply downwards, thus causing global warming scientists’ eyebrows to hit the ceiling. In fact there hasn’t been any warming in 43 years, i.e. almost half a century!
All measurements show that it has gotten colder in the mountains of the Ostalpen over the last 26 years. Emeritus Univ. Prof. Dr. Michael Kuhn, for years on the board at the Institute for Meteorology Innsbruck, formulated in a personal interview: ‘The fact is that winters in Tirol have gotten colder over the last 15 years.’” –
Not only temperatures have been rapidly declining. Also snow amounts in the European Alps have been rising, thus contradicting claims of warming. Zukunft-skisport.at:
Analogous to winter temperatures, also the snow amounts in the last 4 decades have not changed significantly, as they had been predicted to do.”
Figure 4 shows the development of snow depth at Saalfelden (800 m) since 1970/71. Year-to year variation is substantial. The 30-year moving average shows a slight decline.
However, a substantial increase is shown since 1998.
Figure 5 shows the development of ski-lift operation days at Kitzbühel since 1992/93. Here as well we see a trend of more ski-days. The last two years have set new record highs!
Thanks to Tallbloke wordpress once again.
quote from TB
“very interesting paper published in Energy and Environment has found that
the Earth’s actual surface (as opposed to the air temperature 1.5-2m above it, has been cooling since at least 1982
, according to data from the European METEOSAT satellite observation platform, which is in a geostationary orbit above the equator on the Greenwich Meridian”
source of research paper
Click to access 04-Rosema.pdf
From Bob Tisdale Blog
13 yr trend Global temperatures shows a strong inflection point at the year 2005
source
Lets not forget the
VOLCANO ACTIVITY INDEX
Volcano activity is correlated with persistent downturn in solar activity
Being talked about on forums in this case ICEAGENOW
http://iceagenow.info/
( thanks to GAIL COOMBS for the info)
quote
“Salvatore,
On the subject of volcanoes, from Ice Age Now: Wow! Look at how many volcanoes are erupting right now!
one of the commenters mentioned:
JimS says:
June 26, 2014 at 12:00 pm
I did some quick research, and found out that on average, about 20 volcanoes are erupting at any one time. Above is a list of 31 that are now erupting.
Apparently, 2013 – last year – was a record year for volcanic eruptions with about 83 occurring throughout that year. Average years vary between 55 to 60 volcanic eruptions annually.
There seems to be an upward trend in the last few years for erupting volcanoes.
JULY 2014
ANTARTIC SEA ICE IS STILL AT RECORD LEVELS
http://xmetman.wordpress.com/2014/07/10/antarctic-sea-ice-at-record-levels/
Summer snow 2014 In SWITZERLAND closes roads
http://notrickszone.com/2014/07/11/in-switzerland-thing-of-the-past-becomes-a-thing-of-july-more-weather-that-isnt-supposed-to-happen/
Passes closed, avalanche warnings By evening, the online Südostschweiz.ch reported that the Furkapass had been closed. –
Snowfall fell to elevations of approximately 2000 meters, according to the Swiss Met. At elevations of 2000 meters there was a blanket of snow by evening. There was more snow in the high mountain elevations over 2500 meters.” By Wednesday, July 9th, the online Blick here reported Swiss authorities had issued elevated avalanche warnings for elevations near 3000 meters. At Germany’s Zugspitze, the country’s highest peak, 15 cm of fresh snow fell. – See more at: http://notrickszone.com/2014/07/11/in-switzerland-thing-of-the-past-becomes-a-thing-of-july-more-weather-that-isnt-supposed-to-happen/#sthash.iKbPCxcT.dpuf
Current picture of the sun: How many spots can you see today?
This picture will update daily
( on 15th July 2014 ,can see NIL)
Thanks to ‘sparks’ for this link
The Globe has been cooling since 2005

source
Half way down the page
—————–
BOB TISDALE says
“Figure 6 – 162-Month Linear Trends
The highest recent rate of warming based on its linear trend occurred during the 160-month period that ended about 2004, but warming trends have dropped drastically since then. There was a similar drop in the 1940s, and as you’ll recall, global surface temperatures remained relatively flat from the mid-1940s to the mid-1970s. Also note that the mid-1970s was the last time there had been a 162-month period without global warming—before recently.”
Hmmm
There are lists of cold records emerging on the news and internet
so time to quote a few
—————
August 2014
——————–
DEATH VALLEY COLD RECORD
comments
by Holt
AUSTRALIA .SOUTH EAST
16.5% of the large state of NSW in Australia set coldest August Min temp records a few days ago…Adelaide in South Australia also set coldest August Min record for 126 years of data a few days ago…….Still large frost every morning in almost all of SE Australia.
holts7 says:
August 4, 2014 at 6:00 pm.
“Canberra has recorded its coldest August night in two decades, with the mercury dropping below -7 degrees Celsius.
——————————–
Adelaide set a new record for number of cold minimums in a row
5th/6th August 2014
source Livinia weather news NBN
———————————
EAST USA ..Late JULY 2014
COLD RECORDS BROKEN
from a wavy jet stream
http://www.accuweather.com/en/weather-news/midwest-to-feel-septemberlike/30357926
——————————–
NOAA: US Cold records outnumber warm records 66 to 1 in the last 7 days
published.. MARCH 2014
“
28,504 Low Max Records were set in last 365 days according to the NOAA.
A “Low Max” means that the maximum temperatures for the day was the lowest it has ever been.
This indicates daytime cooling.
Only 13205 High Max records were set. That is over a 2:1 ratio. Brrr.
source
Thanks to STEVE GODDARD for reporting on this very telling graph of increased snow cover since 1997
and his discussion
http://stevengoddard.wordpress.com/2014/08/15/global-cooling-since-1997-worse-than-it-seems/
Data source
http://climate.rutgers.edu/snowcover/table_area.php?ui_set=1&ui_sort=0
Steve Goddard @SteveSGoddard · 1h (twitter)
Late summer Arctic sea ice area is increasing, and up 55% over the past two years
http://arctic.atmos.uiuc.edu/cryosphere/timeseries.anom.1979-2008 …
Steve Goddard @SteveSGoddard · 1h
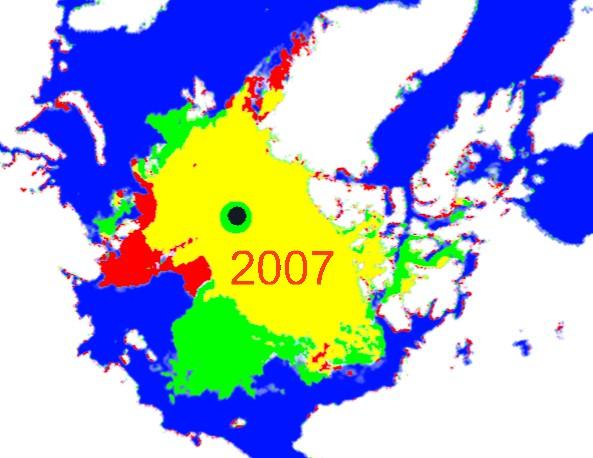
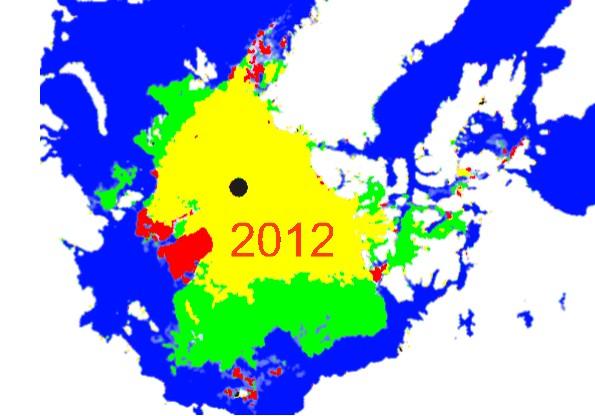
With melt season almost over, there has been a huge increase in Arctic ice since 2007 and 2012
http://stevengoddard.wordpress.com/2014/08/21/arctic-melt-season-almost-over/ … pic.twitter.com/LRyv24Le3C
ARCTIC OCEAN basin cooling rapidly compared to other ocean basins since 2004
EXTRACT from BOB TISDALE
“OCEAN BASIN COMPARISONS
I’ve divided the ocean basins into subsets using the same coordinates I use for the sea surface temperature updates:
◾Arctic (65N-90N)
◾North Atlantic (0-70N, 80W-0)
◾North Pacific (0-65N, 100E-90W)
◾Indian (60S-30N, 20E-120E)
◾South Atlantic (60S-0, 70W-20E)
◾South Pacific (60S-0, 120E-70W)
◾Southern (90S-60S)
The cooling rate of the Arctic Ocean is so out of proportion to the other ocean basins that I’ve shown it separately in Figure 2. One would want to attribute the spike in 2007 to the seasonal sea ice loss that year. Curiously, similar spikes do not appear during 2012 and 2013 when there were comparable or greater seasonal losses.”
Thanks to BOB Tisdale
weathercycles says
( anomalous spikes often occur at the end/start of a new cycle phase or regime: re: the anoml;ous spike in arctic temp in 2007)
Solar cycle 24 just keeps going
“The latest thinking is that this cycle is still on track to be the quietest since the 1750’s,
and looking at this graph from NOAA that we may well be at its peak now.”
Cooling at the poles but warming in the midriff
Antartic and Arctic ice extent update for DEC 2014
http://xmetman.wordpress.com/2014/12/16/sea-ice-malarkey/
FEBRUARY 2015
NEW ENGLAND and BOSTON SNOW RECORDS BROKEN
A very long list of records broken here
http://www.weather.com/news/news/new-england-boston-record-snow-tracker
“Since Feb 16, CONUS (Lower 48) temps have been below normal — by a lot.
Time for an update Crikey! (freezin’ in an unseasonal snowy outbreak here in Victoria Australia!).
record-arctic-sea-ice-growth-continues-on-last-day-of-cop21
https://stevengoddard.wordpress.com/2015/12/11/record-arctic-sea-ice-growth-continues-on-last-day-of-cop21/
30th April 2019
https://www.express.co.uk/news/science/1048495/long-range-weather-forecast-warning-solar-minimum-maximum-space-news
The thermosphere cools and shrinks during solar minimums.
Take some to watch this.. its on! ,volcanic feedback loop
Global Volcanic Feedback Loop Now Causing Unusual Cold Temperatures