Image

Cross equatorial winds

Winds don’t always stay in the same hemisphere . They do cross over in places across the equator 0 deg latitude.In both directions

I am starting this topic thread to investigate the flow of major wind streams from the Southern Hemisphere: SH and into the Northern hemisphere: NH   and vice versa ….in all seasons if l have the time.

I will capture the wind streams using ACCESS G model by BOM Australia

Greater Asia View because l am interested in the flow over Australia and across the equator

http://www.bom.gov.au/australia/charts/viewer/index.shtml?type=windbarb&level=gradient&tz=AEDT&area=DRSMC&model=G&chartSubmit=Refresh+View

Here is my first snap below. 8th September 2019. The first week of the Australian spring.

Notice how the winds from the southern cooler latitudes are conveyed up to the warmer northern mid , sub tropical and tropical latitudes.

You can see the importance of the high pressure cells , in particular the eastern flank, in transporting the cooler surface air to cool down the north latitudes.

The flow doesn’t stop here but continues into the NH in possible favorite more common spots along the equatorial line.

7th sept 2019 wind pattern asiaoz


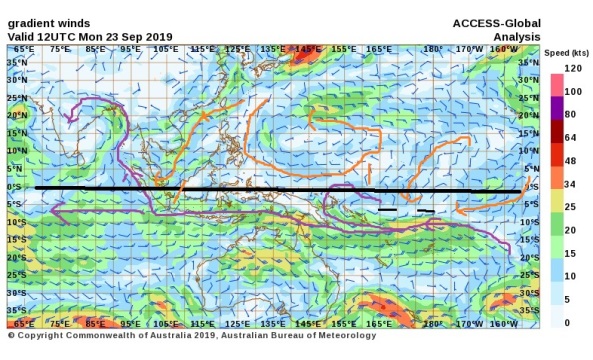
EQUINOX.. 23rd September 2019

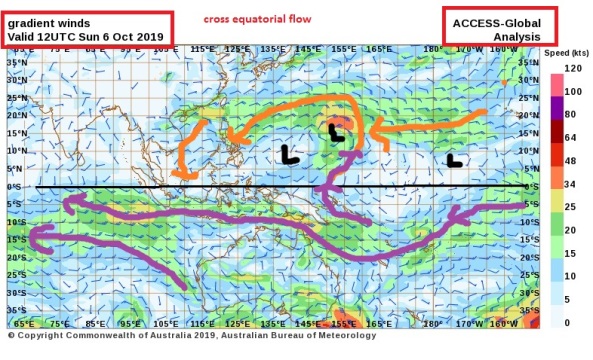
There has been a significant change in direction of the NH wind streams this week. The major stream down past Korea  is on its way to the SH equator and some minor cross equatorial flow in the mid pacific atm

equinox 23rd sept 2019 wind asia


6thoct19 cross equatorial flow


Please go down to the comments section below for all further entries. Click on the heading to load if necessary.


Early twentieth-century warming linked to tropical Pacific wind strength

A significant finding
quote
“and find that weak trade winds and warm temperatures coincide with rapid global warming from 1910 to 1940. In contrast, winds are stronger and temperatures cooler between 1940 and 1970, when global temperature rise slowed down. We suggest that variations in Pacific wind strength at decadal timescales significantly influence the rate of surface air temperature change.”

source of discussion
https://bobtisdale.files.wordpress.com/2014/12/figure-3-129.png

Bob Tisdale - Climate Observations

From the ENSO-can-contribute-to-global-warming department, we have a new paper from the National Center for Atmospheric Research (NCAR) and the University of Arizona (UA). It’s Thompson et al. (2014) Early twentieth-century warming linked to tropical Pacific wind strength.  The abstract reads:

View original post 809 more words

Global average ocean surface wind speeds have been decreasing .. Dr Droy Spencer

source

Are Record Ocean Surface Temperatures Due to Record Low Wind Speeds?

DROY says”
Global average ocean surface wind speeds have been decreasing. In fact, August 2014 had the lowest surface wind speed in about 25 years.

Even after I correct for the typically lower wind speeds that occur with El Nino approaching (-0.5 m/s wind decrease per unit Multivariate ENSO Index value), it’s still at near a record-low since the satellite record began:

Gales across the British Isles 1871-2014

XMETMAN on Gale frequency over time in Britain

gale frequency UK time series

“As you can see there is no doubt that winters [DJF] are slowly getting windier. The trend on the mean gale index is clearly 1.5 higher now than it was 143 years ago, over that time period the moving average shows a slight lull in proceedings between the 1940’s and 1970’s, but it peaked again around 1990, and although the centred moving average as fallen below the trend again last winter produced a record number of 10 days with a gale index of 50 or more. The winter [DJF] of 2013/14 also produced the highest mean gale index of 32.8 which is significantly higher than 1974 and 1989, who were joint second in the rankings with 30.5. “

Paul Vaughan: Wind and Sun – correlation since 1880

How about this !! Correlating the earths wind with solar activity!!
Who would have thought.. !!
Well dome Paul… I see a match!!!.
Now….. to read on…

Tallbloke's Talkshop

Paul’Vaughan posted a link to this plot on the tail end of a long running thread which has dropped off the front page now, so I thought I’s give it prominence today. It’s a ‘food for thought’ starter – the main course will be served as and when Paul has time.

Sun_Wind

It’s all coming together. Both Paul and I have been working on the sunspot integral over the last several years. Back in 2009 I found that by subtracting the average sunspot number at which the ocean neither gains nor loses energy from the monthly value and summing the running total, I could make use of the sunspot integral as a proxy for ocean heat content (OHC).

View original post 197 more words

The Wind is Dying – over land but not ocean?

Didn’t have a section on wind speed time series data
But thanks to Tallbloke for raising this important topic
Lets start..
http://tallbloke.wordpress.com/2014/07/09/the-wind-is-dying-over-land-but-not-ocean/comment-page-1/#comment-82489

Tallbloke's Talkshop

H/T to talkshop contributor Wayne for this short piece from the physics of sailing blog which tells us that near surface windspeeds have fallen over the last 30 years. However, the evidence in a presentation by Hartwig Volz on seawater emissivity I came across yesterday apparently contradicts this. I’ve becalmed-yachtadded a couple of the relevant plot’s from that below the short article, but do take a look at the whole pdf slideshow. The discussion of wind speed is highly relevant to the whole climate debate, including the fundamentals of ocean-atmosphere interaction, energy balance and surface warming. Recall that Hans Jelbring’s thesis was entitled ‘Wind Controlled Climate‘ . 

The Wind is Dying

Wind speed has significantly decreased in the 29 years from 1979 to 2008. In extreme cases, the wind decrease was a significant 15%. More specifically, the wind decreased at 73% of measuring stations which were 10 meters above the…

View original post 308 more words