https://www.longpaddock.qld.gov.au/
 Scroll down to the comments below to view all Long paddock seasonal forecasts from 2019 and onwards.
Scroll down to the comments below to view all Long paddock seasonal forecasts from 2019 and onwards.
Amazing l have never noted that before. A light bulb moment.
Some convincing proof that the condition of the polar vortex affects our weather.
I will put this geopotential height anomaly in the polar vortex on my weekly observation round.
https://www.cpc.ncep.noaa.gov/products/precip/CWlink/daily_ao_index/hgt.aao.shtml


Towns and rural communities across the Basin rely on a healthy river system—our economy, food security and well being depend on it, now and into the future.
Please scroll down to comments below for further information, comments or latest news on climate and the basin.
Click on the heading to load if necessary
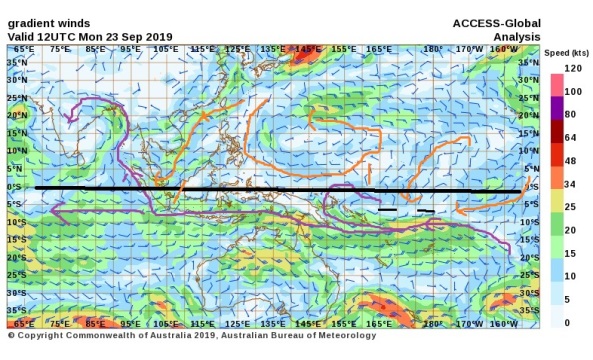
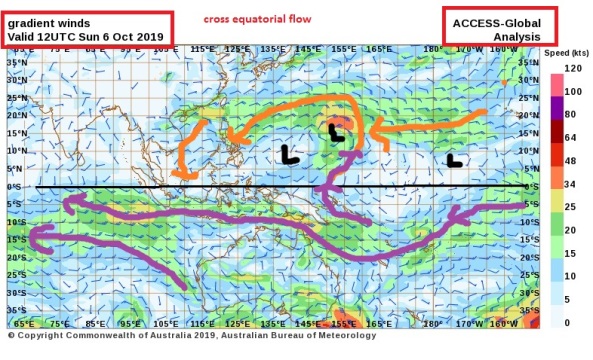
Winds don’t always stay in the same hemisphere . They do cross over in places across the equator 0 deg latitude.In both directions
I will capture the wind streams using ACCESS G model by BOM Australia
Greater Asia View because l am interested in the flow over Australia and across the equator
Here is my first snap below. 8th September 2019. The first week of the Australian spring.
Notice how the winds from the southern cooler latitudes are conveyed up to the warmer northern mid , sub tropical and tropical latitudes.
You can see the importance of the high pressure cells , in particular the eastern flank, in transporting the cooler surface air to cool down the north latitudes.
The flow doesn’t stop here but continues into the NH in possible favorite more common spots along the equatorial line.

EQUINOX.. 23rd September 2019
There has been a significant change in direction of the NH wind streams this week. The major stream down past Korea is on its way to the SH equator and some minor cross equatorial flow in the mid pacific atm
Please go down to the comments section below for all further entries. Click on the heading to load if necessary.
A collection of pictures . All further posts will be in comments section below. Click on the heading to load them if necessary
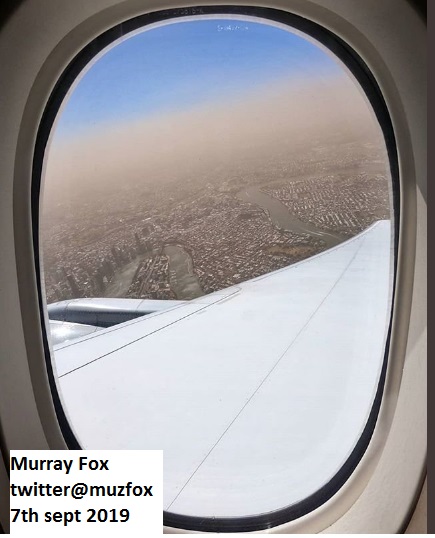
High pressure subsidence not helping
Possibly Canungra fire. Fire at Tenterfield as well and may be others in the hinterland

Thanks to Ken Kato for these satellite images
https://www.weatherforum.com.au/Forum/posts/t3-SE-QLD-and-NE-NSW—Day-to-Day-Weather/page10


Read on here
https://www.britannica.com/science/Indian-monsoon

Technical
http://www.imd.gov.in/pages/monsoon_main.php
Public
All further information is in the comments section below.
Click on the title to load if necessary
Predicting temperature extremes and dry conditions over spring and summer is vital for agriculture, water supplies, bushfire risk and human health. But to make accurate predictions the Bureau of Meteorology needs to better understand the climate drivers behind such extremes.
Bureau researchers have recently identified how wind patterns in the stratosphere around Antarctica can drive hot and dry conditions over southern Queensland and northern New South Wales.
This research was undertaken by the Forewarned is Forearmed (FWFA) project, which is part of the Federal Government Rural R&D for Profit program. FWFA is supported by the Bureau, a range of Rural R&D Corporations, Universities and state government agencies.
While most weather systems like storms, rain and high pressure systems are found in the troposphere, the relatively turbulent first layer of the atmosphere, the stratosphere above it is known for its stable air flows. Commercial airplanes target this layer to find jet streams for a smooth and efficient flight.
A key feature of the stratospheric circulation is the development of the wintertime polar vortex, whereby Antarctic circumpolar westerly winds (extending up to 40-50 km altitude) seasonally strengthen from autumn to winter as the polar cap region seasonally cools. The vortex weakens and breaks down during late spring as the polar cap warms up. In some years the vortex warms up and breaks down early, which can lead to hot and dry conditions on Australia’s surface during late spring-summer.
The early weakening of the polar vortex results in a strong downward air flow and a lack of clouds over eastern Australia (Figure 1) via another large-scale circulation that Australian farmers already know – a negative Southern Annular Mode (SAM) according to Bureau researcher Dr Eun-Pa Lim.
“A negative SAM is responsible for bringing hot and dry conditions to eastern Australia in our warm seasons” says Dr Lim. “Anything we can do to improve our ability to predict SAM will help people on the land to prepare for and manage these conditions. The long time–scale of the polar vortex weakening, which spans several months, means if we can capture it in our model, we can potentially predict low SAM conditions during late spring as early as late winter.”

Figure 1. A strong weakening of the polar vortex and the associated negative Southern Annular Mode leads to an abnormally strong downward air flow and a lack of clouds (orange indicates less than average cloud cover) over eastern Australia, which results in higher than average temperatures and dry conditions. This plot shows the cloud cover variation in late spring-early summer following the early break down of the polar stratospheric vortex.
But just what is a polar vortex and how does it influence Australia’s climate?
The abnormal weakening of the polar vortex and its downward coupling in spring to summer can be visualised in Figure 2. During winter the westerly winds associated with the SH polar vortex are stronger than usual in the upper stratosphere (as shown in orange), which can allow more atmospheric waves to propagate from the lower atmosphere into the stratosphere. Because these vertically propagating waves act to weaken the upper stratospheric westerlies, the polar vortex starts to weaken from early spring. As the vortex weakens over time, the weakening signal descends (shown in blue). The impact is felt at ground level from October to January.

Figure 2. When the abnormal polar vortex weakening happens, generally the vortex is abnormally strong during winter (shown in orange) and then weakens rapidly in spring. The process of weakening of the westerly winds descends after September (blue). Exact timings of the strengthening of the winter polar vortex and its subsequent weakening in spring to early summer can vary year-to-year. Wind (m/s) is measured as being stronger or weaker than the average.
Developing an index to measure polar vortex weakening and strengthening has been a vital part of the Bureau’s recent research and has made it possible for them to study the impact of these events on Australia’s seasonal conditions.
“The Bureau has developed the stratosphere-troposphere (S‑T) coupled mode index to identify these events and quantify their strength,” says Dr Lim. The index is based on monthly average wind data (1979-2017) over the Antarctic sub-polar region (55° to 65° South) at all available vertical levels from the surface to 50km altitude.
The index allows the Bureau to measure whether the polar vortex weakening is progressing at its usual pace. A high index means unusual weakening which leads to faster vortex breakdown. The strongest weakening event occurred in 2002 (Figure 3), which was related to the strongly negative SAM in spring 2002 that is believed to have played a more important role in driving hot and dry conditions than the relatively weak El Niño observed in the same year.

Figure 3. The Bureau have developed the S-T coupled mode index to identify polar vortex weakening (in red) and strengthening (in blue) events. The strongest vortex weakening event on record occurred in 2002 (based on monthly average wind data from April 2002 to March 2003 compared to wind data of all years).
The Bureau’s S-T coupled mode index also highlights other less dramatic, but still significant, polar vortex weakening/strengthening events. By comparing historic temperatures and rainfall for the October to January period with the index the Bureau have found a very strong correlation between the polar vortex weakening and hot and dry seasonal conditions in southern Queensland and northern NSW.
For instance, maximum temperatures (Tmax) in the nine polar vortex weakening years (Index ≥ 0.8) were 1.2°C to 1.8°C warmer over southern Queensland and northern NSW than in the other 29 years studied between 1979 and 2017 (Figure 4). At the same time rainfall was 0.4 to 1.2 mm per day lower; that’s around 12 to 36mm a month.

Figure 4. The October to January mean maximum daily temperature is between 1.2°C and 1.8°C warmer and rainfall is 0.4 to 1.2 mm/day lower over southern Queensland and northern NSW during the nine identified polar vortex weakening years than in all the other 29 years.
“When you consider the seven hottest years (the top 20 per cent) – they are over four times more likely to occur when it is a polar vortex weakening year than a non-weakening year,” says Dr Lim.
“The research demonstrates that the Antarctic polar vortex is an important driver of heat and rainfall extremes in subtropical eastern Australia during late spring to summer.”
“The Bureau’s new ACCESS-S seasonal forecast system has a high level of skill in predicting S-T coupling from the beginning of September, which will improve our ability to predict temperature and rainfall extremes for the spring and early summer in polar vortex weakening years,” she said.
This result of the Bureau’s research implies that if land managers can be warned in September that they are likely to face hot and dry conditions through to January due to the polar vortex weakening, it will put them in a better position to make timely decisions such as how to manage livestock numbers, pastures and their supply of supplementary feed.
Lastly, since the beginning of spring 2018 the stratospheric polar vortex has been stronger than usual, which is likely to have somewhat mitigated the hot and dry conditions promoted by the development of El Niño over Queensland and northern NSW. This was something we could be thankful for during the tough dry spring of 2018”
Eun-Pa Lim, 03 9669 4000, eun-pa.lim@bom.gov.au

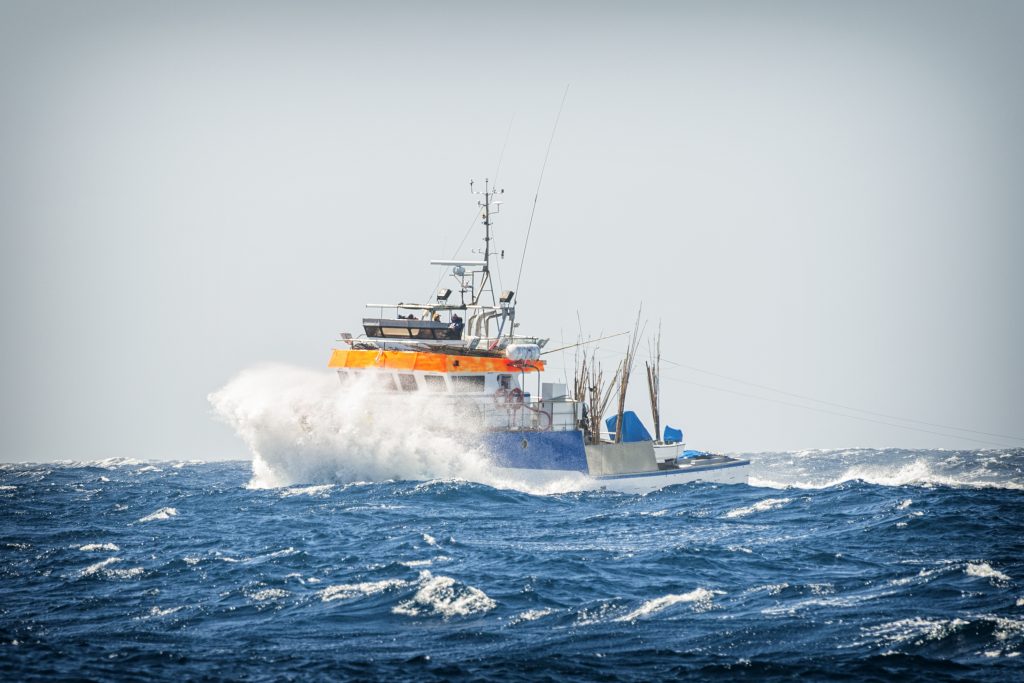
Operational Oceanography is like weather monitoring and forecasting for the ocean. It can provide estimates of essential ocean variables (e.g. sea level, temperature and currents) for the present and the future, as well as for the past.
Ocean observations are required in real-time and near-real-time (within a few days or minutes of collection) and sourced from various national and international programs.
Some of these services are run in an operational setting, for example the World Meteorological Organisation or the Intergovernmental Oceanographic Commission.
Others are maintained through research funding, for example Australia’s Integrated Marine Observing System.
Australia’s operational ocean forecast system, operated at the Bureau of Meteorology has been developed under a partnership called BLUElink.
BLUElink is a partnership between the Bureau of Meteorology, CSIRO, and the Royal Australian Navy.
Just go in and have a look


Fabulous archive of climate emergency media publications in the past 10years. Good work. Very interesting

View original post 10,629 more words
