For all states
GO to comments section below for my latest regular updates regarding upcoming weather events.
Click the heading to load if necessary
___________________________________________________________________________
After the stalled synoptic pattern of Jan 2019.
I thought l would continue posting . The east coast ridging has finally budged since NOV 2018 ( today is 7th feb 2019)The synoptic below shows the first troughing we have had since then. THE AAO was highly positive during this summer period
Fi
Finally a change in synoptic pattern after 2 months
This pattern is different and probably transitional
FE
 westerly belt replaces the high in the Bight. Signs the westerly belt is becoming more zonal ( wavy). The lack of MSLP gradient is evident on the mainland

Mount baw baw reporting snowing 12th feb 2019
Jane Bunns twitter page
Also snowed in Tasmania .
The AAO has started dropping
AAO has gone negative and westerly belt is relaxing . Some waves and meridonal synoptic pattern emerging.
Here is westerly belt with AAO at -2 on 23rd Feb 2019
The AAO dropped from +2 on the 5th Feb to -2 which it is now on the 22nd feb
source AAO
Here is a snap of the westerly belt responding not only to the change in season but also the AAO going negative.

This is the likely implications for a strongly negative AAO.
Some synoptic changes appearing. We seem to be entering a ‘weather pattern shift’
Firstly big dip in AAO brings wavy westerly belt and wavy jetstreams
A couple of massive surface highs (1031hpa)appearing on ACEESS g surface synoptic in 6 days time. Symmetrically expanded like balloons if you will. With a long N/s aligned trough in between
Hobart , Tasmania currently 1031 hpa 13.4 deg 8pm with a southerly today 23rd feb 2019
http://www.bom.gov.au/australia/charts/viewer/index.shtml
Massive kinks in the sub polar jet stream ( although it is still quite south currently.
A decent kink even in the sub tropical jet later this week.
Quite a dynamic picture.
Wavy Jetstreams often associated with extreme weather..
Implications include../ Cut off lows/ swinging from hot then very cold weather, snow on alps, Strong frontal systems on the exit of upper troughs .
Noticing we have a precipitation signal under a massive high next Friday.?
Uppers showing the exit branch of the 200hpa sub tropical jet.
A big negative AAO dip is exciting for dynamic weather set ups
The questions is how long will this new pattern last?
Here is a snap forecast for 1st day of autumn 1st march 2019

Upper trough. Mid level low.
Big time 1033 hpa high centred west of the sth island of NZ
strong onshore 20knot on to the east coast
1st March 2019.. First day of autumn. The AAO went negative a few weeks ago.

Which produces wavy Jetstream patterns.
Here on GFS global cloud you can see the exit regions of the upper 200 hpa jet stream which produce the NW/SE cloud bands with moisture transfer form higher to lower latitudes.
Opportunities for moisture to mid latitudes if this pattern continues
We have a NW / SE aligned cloud band developing in WA currently
From the equator to the sub polar region
It is a common feature of the upper 200hpa atmosphere.
I have always wanted to map out the synoptic for one of these classic sat pictures we see quite frequently .
It is associated with a highly neg AAO and associated wavy jetstreams( both sub polar and sub – tropical )
Here is the sat pic’ at 5pm today .
The NW/ SE cloud band is marked with an orange line.
The jet streams l have marked are current data from ACC r 200hpa gradients /winds
The sub tropical jet in yellow
The sub polar jet in purple.
Here is a zoom in view of that NW/SE aligned cloud band currently formed over WA on the 3rd of March 2019. It is formed by a combination of wavy sub tropical and sub polar jetstreams. Associated with a highly negative AAO
The sub polar jet is leading to the east and the sub tropical jet a tad behind at the lower latitudes
The exit regions of these Jetstream bends (‘hills’) form cloud frontal bands from forcing/ pushing of the atmosphere from west to east.
A classic NW / SE aligned cloud band

AAO has been negative since FEB 8th 2019. and peaked negative on the 20th Feb at minus 2.4 .
Here is snap of the response of the upper atmosphere 200hpa jetstreams .
They become dynamic and very wavy
link to AAO/SAM time series and current value
https://www.cpc.ncep.noaa.gov/products/precip/CWlink/ENSO/verf/new.aao.shtml
Possible low level snow for Tasmania

A dynamic surface synoptic forecast for 8th -March 7 day forecast
—
Hi all. Sorry this is a long post but wanted to share the current surface synoptic pattern dynamics with you.
——————-
The surface synoptic is quite dynamic currently as is the upper 200hpa.
. The overall pattern is on the move and changing quite quickly.
Some features to note . There is a see saw pattern of tropical dip in isobars and then westerly belt long wave troughing well into the sub tropics this week.
and of note is
that the tropical dip in isobars is not confined to the west of the divide but transits to the east and pops out along the coast.
This occurs because the trough is NW/SE aligned instead of N/S aligned.
The synoptic was so dynamic that l had to take some notes to decipher and look for a current pattern.
When l watched the ch 9 weather news they had an animated synoptic of the greater Australian region and you could see the synoptic pulsating and ‘excited’ .
Sorry this is long winded but couldn’t find a static synoptic capture that explains the situation.
The models have to deal with all this fast synoptic change.!!
———
Here tis.’ for this week for the east quadrant of OZ’ from ACC g
————————-
East quadrant Australia ..synoptic pattern this week
friday night 8th March> high pressure ridging up to 20s..High 1026hpa centred west of NZ.
Tropical dip in isobars inland qld and NSW 20 to 33s!!
saturday morning ridging contracts to the SE and is replaced with a deep tropical dip in isobars to 39s!off the coast of sth NSW by 2pm
The tropical dip axis running NW/SE 8pm by 11pm tropical dip axis weak N/S aligned with weak ridge up the east coast and a cut of low has formed off east gippy’ from a tropical dip in isobars.
I have never seen a cut off from a tropical dip in isobars myself but maybe l have never looked.
Low pressure over all Australia everywhere less than < 1016hpa saturday midnight.
Sunday morning. 11am High pressure in Tasman weakens further at 1021hpa and ridging up the east coast . Gone.
Sunday morning an incursion of the westerly belt emerges up into east NSW and QLD. Closed isobar up to 26s!!
By sunday afternoon this contracts south and leaves a weak but very brief triple low complex embedded in the troughing.
Monday morning .weak trough with another incursion of the westerly belt isobars this time right up to 22s on the qld /NT border
This low pressure westerly belt protrusion as weak as it is, lasts all monday and into tuesday morning up the east quadrant of OZ'
This troughing deepens tuesday afternoon and affects our area
wednesday.
High pressure moving into NSW from the west.
but Brisbane and surrounds still in the trough with some precip'
wednesday arvo a tropical dip in isobars emerges again ,down the qld ranges with some precip on the east flank.
wednesday evening . tropical dip extends right down to Albury Victoria and is west of the divide.
Thursday.. tropical dip in isobars generally covers all of the mainland as we pass through a temporary weakening of the mid altitude high pressure belt.
——————————–
Do you se what l am saying.
At latitude 28s and surrounds ( our thread area)
. WE are one day having a tropical dip in isobars and then the next day we are having a mid latitude protrusion of isobars. and then over again.
So we will have to keep abreast of the quick changes
http://www.bom.gov.au/australia/charts/v…it=Refresh+View
AAO neutral .phase .13th March 2019

weak. mid latitude high pressure cell ‘l. centred at Tasmanian latitude
Tropical dip in isobars , NW/SE aligned,on the east coast bringing stormy burst
At the 500hpa mid layer there is a trough in the east quadrant over NSW aligned NW/SE
.It is forecast to strengthen over the next 48hrs A closed embedded low mid layer will form over NSW
Upper layer 200hpa also an upper trough.
SEQ will be in the exit arms of the sub tropical jet
_____________________________________________________
Snap of storms Long the surface trough and extending eastward along the eastern flank of the trough along the mid QLD coast
Satellite picture showed exploding convection of storms Long the surface trough and exit region of the tropical jet along the mid QLD coast
http://www.bom.gov.au/australia/charts/viewer/index.shtml?type=windbarb&level=200hPa&tz=AEDT&area=Au&model=CG&chartSubmit=Refresh+View
17.th march 2019 vertically stacked low

http://www.bom.gov.au/products/national_radar_sat.loop.shtml
The AAO has dropped from positive 2 on the 17th March and is now 0.5 on the 25th March . Quite a steep gradient drop in 8 days.
What is noticeable on the synoptic animation forecast from ACC g.Is that the speed of flow of the high pressure belt from west to east has increased as the AAO has dropped toward neutral
https://www.cpc.ncep.noaa.gov/products/precip/CWlink/ENSO/verf/new.aao.shtml
Noticing the time between troughs in the mid latitude belt is about every 3 days currently.
We have a trough in the east quadrant today; 25th March and the next is friday 28th
.The spacing.
As trough arrives in the Tasman west of NZ . The next is sitting on the SW WA coast.
The mslp of highs in the Bight . 1026-1030ha. I believe the lower strength is due to the higher speed of the high pressure conveyor belt. The highs also tend to be more elongated and have a wider west /east axis.
High pressure belt centred at 37s with AAO at +0.5 this week
When the belt is going slowly , the highs can strengthen and enlarge. It is a current observation, l will have to test further with more obs’
Rain from Qld /NSW border through to mid Qld coast bringing rain.

27/28th March 2019
source
http://www.bom.gov.au/australia/charts/viewer/index.shtml?type=windbarb&level=gradient&tz=AEDT&area=Au&model=CG&chartSubmit=Refresh+View
Strong trough forecast 29th -30th March 2019

http://www.bom.gov.au/australia/charts/viewer/index.shtml
forum discussion on this event here
http://forum.weatherzone.com.au/ubbthreads.php/topics/1496716/Re_SEQLD_NENSW_Onshore_flow_en#Post1496716
1st Apr
AAO is trending positive. at 1.0 Up from neutral 0.5 about a week ago
Expecting jet streams to temper and become more zonal (less wavy) and the speed of the high pressure belts easterly migration to slow.
This is seen this week with the next trough arriving in east OZ in about to 8-9 days.
The slowing high pressure belt allows the highs to establish and strengthen like balloons.
15th may 2019

Picture of upcoming low with tropical infeed . Vertically stacked .
AAO on brink of trending down this week
This low sits between the zonal tropical jet and the polar jet is under the southern flank of this low
A large 1035hpa high stalled in the Bight .Is bringing cold air up from the sub polar region. This is creating some cold records for the eastern quadrant of OZ


quote from ‘lani’ Weatherzone forum. Dalby SEQueensland
Record smashed this morning for coldest May Day in Dalby. Was -2 in the year 2000, currently -3.4 in Dalby. And to make it even colder, it’s -4.5 at home in Jimbour. Brrrrrrr
…
Ken kato. thanks
‘sigerwand’
Just saw that there was a -9.5C at 5am on the Glen Innnes Ap readings. Impressive!
30th may 2019 continued
‘kino’
Moss Vale, Cowra, Young, Port Macquarie, Kempsey all got records, some smashed them, including Young which stood since 1977…
‘jacob’
To add to that Dalby and Applethorpe in QLD also beat their records. Applethorpe has almost 50 years of data and beat it’s May record by 2.1°C which is a wide margin.
blairtrewin’
Also a Queensland state record at Stanthorpe.
synoptic stalled high
200hpa stratosphere temps’

Strong cold anomaly over the stalled high
but wonder if the stalled high is caused by the cold continent and cold sea anomaly in the BIGHT?
comment by ‘Robg’ on weatherzone forum
http://forum.weatherzone.com.au/ubbthreads.php/topics/1499842/6
May 2019 in Sydney is very likely to be the 4 warmest on record in terms of average temperature. Only other years as warm: 1958, 2017 and 2007. Even the average minimum was warm (in 2nd decile), despite very dry conditions and dominant HP ridges that should promote cold nights. There are similarities with 1958, the warmest Sydney May on record, which was also very dry with mild nights and warm days.
GOOD NEWS.
Forecast for SW WA . 6th to 8t June 2019..T + 150hrs
Finally a stalled 1040hpa high centred in the Bight makes its move eastward on thursday the 6th June . This gives way to allowing a strong trough extending to 28s to migrate on to the west coast.
2 moisture streams infeed into the surface trough from the sub tropics courtesy of jetstream position no doubt.
ACC g has a very good precipitation signal for this event

http://www.bom.gov.au/australia/charts/viewer/index.shtml
4th July 2019

High amplitude troughing peaking at SW WA., with some equatorial infeed.
Tropical low with weak cross equatorial flow at 162e 9s
1041hpa high SE of Tasmania
7th July 2019

source
http://www.bom.gov.au/australia/charts/viewer/index.shtml?type=mslp-precip&tz=AEDT&area=GAuR&model=CSCG&chartSubmit=Refresh+View
source
Click to access IDY65100.pdf
Forecast for wednesday 10th July

A cold front comes through SW Victoria on wednesday arvo’ about 4pm.
A decent rain band for the west of VIC.
By 1am in the morning the band is over the VIC alps.
Thickness at 1am 544 on alps, dropping to 536 in the evening.
The rain band looks to arrive at 1am for the 544 thickness but still some precip’ for that colder air early on thursday morning
JULY 2019

A wave wave from the westerly belt slaps SW WA with a cold front and precipitation
Possible embedded storms
18th JULY 2019..


Noting very low dew points right across the continent and over t he oceans atm
Weak sub polar jets still recovering from polar vortex split and stratospheric warming since may 2019 and is still in play
The AAO has reached its neg’ peak and is forecast to to go upward this week
Westerly belt is struggling to provide any significant excursions northward.
Sub tropical jet still strong in velocity .
forecast for the 23rd july 2019 showing a cold front and moisture slapping Victoria this week
Oh..,A little bit of action for the SA ers’
Late sunday the 28th July a precipitation signal appears on ACC g over the southern SA region. and intensifies into monday the 29th July
A tropical dip in isobars at the surface layer.

Combined with support from a weak 500hpa trough
at the 200 hPa payer above ,a tad of convergence as some minor sub polar windstreams converge with a strong sub tropical jet.
http://www.bom.gov.au/australia/charts/viewer/index.shtml?type=mslp-precip&tz=AEDT&area=Au&model=CG&chartSubmit=Refresh+View
A nice change from our very stable weather atm
Forecast for August 8th 2019
A strong 972 hpa low centred neat Tasmania, coupled with a strong 1035hPa high to its west should provide a good engine for this system.
The SW flow is flung well into NSW /QLD border.
There is strong precipitation signal for many parts of SE OZ.
Snow for the alps looking very promising with low temps and precipitation aligning for overnight wednesday the 7th and into all of thursday, and thursday night and up until friday morning about 10am.
36 hrs of snow making conditions.

Adelaide cold pool 8th August 2019
peaks at 536 thickness 4am
There is a precip’ signal over the alps wednesday night 7thAugust. This picture is for 10pm.
The rain signal extends northward into eastern NSW into thursday as the trough passes through
536 thickness for the alps all day thursday as this trough passes through.
with moisture availability
There is snow on the BOM forecast every day this week
Range 35cm to 95cm
http://www.bom.gov.au/places/nsw/perisher-valley/
Forecast t+120 hrs
14th August 2019
Long wave trough with North west infeed moisture for WA
Quite good prospects for rain and storms.
source
http://www.bom.gov.au/australia/charts/viewer/index.shtml
16th August 2019
ACC G has a westerly belt trough crossing SW WA on friday night .15th August 2019.
Quite a well defined robust front line at about 10pm
The cold pool sits behind with thickness down to 536 on saturday
This trough contracts east in to south coastal SA on sunday 18th August
Rain band and thickness down to 532.
SW WA to get another westerly belt trough and cold front, with tropical moisture infeed from the Indian ocean.
A weak protrusion of the westerly belt forecast over Victoria t +162hrs
by ACC g
There doesn’t appear to be any extreme cold pool associated with this one .
Cold front and a tad of rain for many parts of VIC, more so the coast.
August 26th 2019
The tip,of a trough might bring a few drops of rain to a dry coastal NSW QLD border. I should know l saw it today. Dry long grass on the coastal foreshore. Dry and brown on the coolongatta foreshore.My garden is dry. Any drops appreciated
August 28th 2019
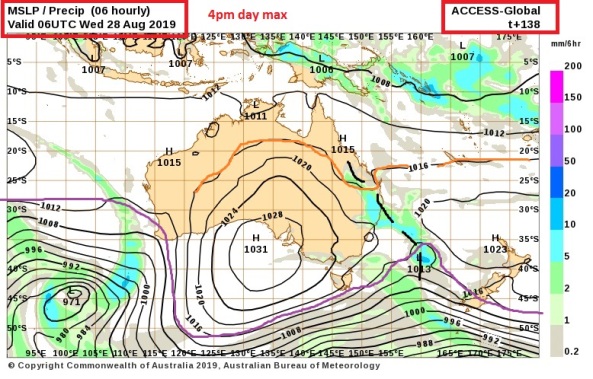
Is this the start of the SE QLD storm season.
Here we have a small tropical dip in isobars aligning with a protrusion of the westerly belt (troughing).
We have a 500 and 200hPa trough supporting the surface albeit this upper troughing sits a tad west of the surface trough line.
Add in a tropical moisture stream down the 155w longitude line and voila’ we have what is likely to be our first significant weather event.
Wednesday the 28th is the start of this event. ACC g shows what looks like an atmospheric river infeed strengthening into thursday the 29th Aug extending right along along the Queensland coast from Townsville to Sydney.
The precip’,signal looks to cover the ranges and maybe a tad over to the west of the divide.
…………….
And lets add :29th August 2019
Another nice trough and cold front for the SW WA.
ACCG forecast t+ 162 hrs
With a tad of Infeed from the Indian ocean
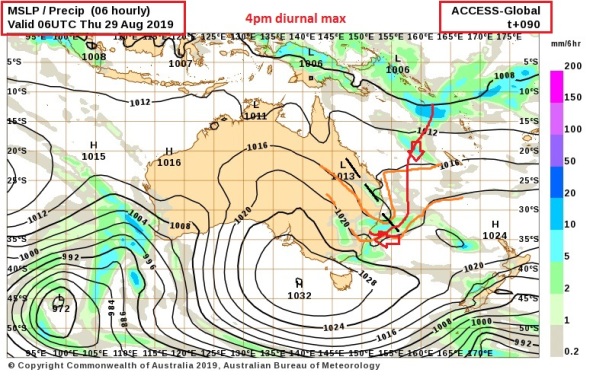
August 29th 2019
A big tropical dip in isobars off the coast of east Australia draws tropical moisture down to a low off the NSW .Some of this wetstuff is directed onto the coast via a SE onshore flow.,This be a welcome break from the winter dry spell.
wednesday 28th aug 2019
tropical dip in isobars .
Moisture infeed from the north coral sea
Likely increase in dew points
2 small low pressure eddies on the trough line
Max precip’ or storms most likely diurnal max in the afternoon. This is when ACC r has the strongest precip’ signal.
The extent of the signal is quite broad , running from west of the divide at Townsville
region right down to west of divide near Sydney. This signal extends to the coast.
Another westerly belt trough for VIC, wednesday the 28th Aug 2019
A precipitation signal from ACC r.
The front arrives on wednesday about 10pm.
The mslp is a curious 1020 hPa as the front hits the Victorian south west coast in the evening. The front and trough migrate across VIC on thursday picking up extra moisture from a low off NE Tassie’ which looks to wrap up some tropical moisture streaming down from the northern coral sea.
This benefits east VIC on thursday with enhanced rainfall and should l dare suggest
thunderstorm activity.
http://www.bom.gov.au/australia/charts/viewer/index.shtml
27th August 2019
Tomorrow we may have something to watch
Tropical dip in isobars in SE QLD commences and looks to be in place for the next 5 days. Something to talk about .
Noticing ACC g showing weak precip’ signal on the hinterlands tomorrow at diurnal max from about the NSW /QLD border , right up to ould you believe Rockhampton.
I did say a weak signal..Looks stronger wednesday, thursday for lucky ones.
http://www.bom.gov.au/australia/charts/viewer/index.shtml
29th August 2019
Finally some rain for NSW
A tropical dip in isobars with a moist onshore flow from the coral sea, should see dew points increase over NSW
ACC g forecasting some rain for many parts of NSW on thursday the 29th Aug and then into friday more so coastal regions
The Sydney region may get a thumping early friday morning 4am..as a closed low forms off shore and Sydney and south of Sydney coastal latitude looks to be on the stronger southern flank.
Chances of storms …
27th aug 2019 convection kirra jear coolongatta SE QLDtropical trough

28th aug 2019 storms on trough line in QLD
28th aug 2019

Front and trough passing through VIC
Here is the rainfall totals from the front and trough
source
http://www.bom.gov.au/vic/flood/index.shtml
29th Aug 2019
Tropical dip in isobars draws a stream of moisture down from the northern coral sea all the way down to NSW latitudes
South easterly onshore and a small low off shore will direct this moisture over the coast.
This 4pm picture shows a bit of an extreme signal near Sydney region tomorrow afternoon.
Sydney latitude 33s. So a good weather watch for you ‘guys’
29th August. Moisture laden on shore flow from a tropical infeed being directed on to the coast via south easterlies from an emerging high pressure ridge.
1st September 2019…Calender Spring
Tasmania starts spring with some rain courtesy of a westerly belt trough enhanced by 500hPa mid layer troughing
The tropical stream from the coral feeding in to nth of Sydney, Newcastle district continues today.
Some serious rain totals nth of Sydney yesterday again
91mm for The Entrance.
The final totals tomorrow will be interesting
weatherzone report says
Gosford received 114.4mm in the 24 hours to 9am on Friday morning, with a further
84mm over the following 24 hours. This makes it the heaviest two-day rainfall since early June 2016 when just shy of 215mm fell in 48 hours.
https://www.weatherzone….pressive-rainfall/530153
Final totals after the 3day deluge

source
http://www.bom.gov.au/jsp/awap/rain/index.jsp?colour=colour&time=latest&step=0&map=totals&period=week&area=ns
1st september 2019

Storms and cold front for VIC and PERTH /SW WA
Cut off low from the westerly belt forms around Friday 5th of September and intensifies into the 6th and 7th. (weekend)
This system is likely to affect SE SA, ALL of VIC and many parts of NSW.
ACC g also has it forming an ECL off the coast of NSW.
So a widespread event and something to chatter about for those living in SE OZ
Possible low level snow

http://www.bom.gov.au/australia/charts/viewer/index.shtml
24hr forecast


Could be some reasonable snow on friday night
536thickness and good precip’ signal
Aug 2nd Rain band going through West Vic weak moist trough

3rd sept 2019
Clear skies over the mainland bringing warming to the continent
5th Sept 2019

Morning of 6th Sept 2019

ACC g continues to see this cut off low as a significant rain event for Victoria.

This picture is for 4pm diurnal max.
There was a downgrade in intensity on this forecast but the nuts and bolts still in tact

and in real time, here she is. Afternoon diurnal max doing its thing
Radar late afternoon

4th sept 2019
