“The solar cycle was discovered in 1843 by Samuel Heinrich Schwabe,”
http://en.wikipedia.org/wiki/Solar_cycle
Here l am starting a post on some research l am doing on solar cycles, planetary motion and simple correlations to Earths macro climate
Please click the title of this post to load further information and comments , found at the base of this page
TITLE
SCHWABBE TRIPLETS
https://picasaweb.google.com/110600540172511797362/TIMESERIESAndTrends#6017611658711370978
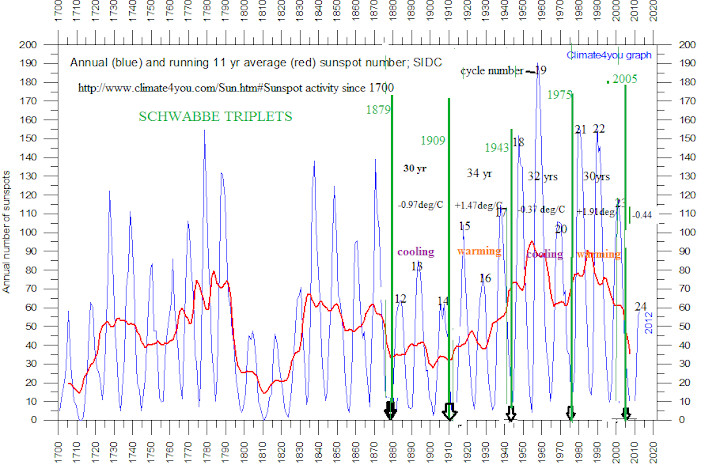
The schwabe triplets coincide with the AMO and global temp cycle
The length of the AMO/global temp oscillation appears to be determined by the length of the schwabe triplet which is made up of 3 schwabes of varying length ( one AMO phase)
Firstly l would like to thank Dr Scafetta for publishing his fine research on the links between planetary motion and the earths climate. This was my first encounter with this branch of science l was totally in awe of his findings in particular his research based on CYCLES ( natural variation of the earths climate)
http://people.duke.edu/~ns2002/
Secondly l would like to thank Tallbloke wordpress
http://tallbloke.wordpress.com/
( and all of the management and his contributors to opening my eyes to a side branch of Scafetta’ research and that is the role of
PHI
in the structure of the solar system including the earth.
I am attempting to keep an index of all there posts related to this study
I have spent much time over the course of the past couple of years collecting information on cycles
Quite recently l have come across a solar and planetary link to global temperature trends.
I have not seen any research on this topic of SCHWABE TRIPLETS
So l thought it wise to start my own on-line on-going research whilst l progressively delve into this concept
My notes and diagrams below in the comments section are a record and a place to store findings and information
Feel free to follow my progress and feel free to comment
Regards
FROM SUSAN MORROW. TWEED HEADS NSW AUSTRALIA
ALIAS(‘CRIKEY OR WEATHERCYCLES)
——————————————-
…Be warned. Nothing is in order. I am posting as l go.

Just dumping some of my notes and comments from a Tallbloke.wordpress blog here for my reference
———————————————————————————————-
FORUM DISCUSSION NOTES
————————————
think it is good Willis plays the ‘devils advocate’ and drops by to Tallbloke to argue the negative. Keeps you on your toes so to speak.
————————–
Willis says “I’m sure you can see the problem. Each half of the data is a hundred and seventy-five years long. The ~24-year cycle exists quite strongly in the first half of the data, It has a swing of over six tenths of a degree on average over that time, the largest seen in these CET analyses.
But then, in the second half of the data, the 24-year cycle is gone. Pouf.
Well, to be precise, the 24-year peak still exists in the second half … but it’s much smaller than it was in the first half. In the first half, it was the largest peak. In the second half, it’s like the twelfth largest peak or something …
——————————–
His observation is VERY important
I believe this is explained because there are more than one solar system cyclic forcing factors on the CET temperature. Not JUST the moon
Qian et al 2010 shows how various cycles overlay in time. They identifies 4 major cycles one being 21.1 yrs
These cycles form sine waves
As the cycles overlay you will have destructive and constructive interference
A cycle can be cancelled or can go ‘poof’ if another cycle overlays to cancel the amplitude of the 21 yr cycle
Inter-cycle modulation
Now what math’ would you use to separate those cycles
or maybe it would be better to use qian’s model which uses wavelet transform?
They identify how the CET and global temp’ series has trended upward as a number of major cycles constructively overlay. peaking around 1998 -2006
and what goes up , must come down. 4 cycles on their way down
including cycle 21/23?yr
so qian concludes we will have global cooling
and so the benefits of cycle analysis
There is more than one to consider and how they interact
———————————–
Another study by qian for the china climate also identifies a ~20yr cycle
so why would England be exempt
abstract
Climatic time series from historical documents and instrumental records from China showed temporal and regional patterns in the last two to three centuries, including two multidecadal
oscillations at quasi-20-year
and quasi-70-year timescales revealed by signal analysis from wavelet transform.
Climatic anomalous events on the decadal timescale were identified based on the two oscillations when their positive (or negative) phases coincide with each other to amplify amplitude.
The coldest event occurred in the decade of 1965–1975 in eastern China, while the periods of 1920–1930, 1940–1950, and 1988–2000 appeared to be warmer in most parts of China. For the precipitation series in northern China, the dry anomalous event was found in the late 1920s, while the wet anomalous event occurred in the 1950s. A severe drought in 1927–1929 in northern China coincided with the anomalous warm and dry decade, caused large-scale famine in nine provinces over northern China
Climatic regime shift and decadal anomalous events in China
Weihong Qian, Xiang Lin, Yafen Zhu, Yuan Xu, Jiaolan Fu
http://link.springer.com/article/10.1007/s10584-006-9234-z
———————————————————-
So now to clarify the role of the solar , lunar and planets.
———————————-
Barts post
quote
Periods work out”… to 5, 5.9, 5.4, 65.6, 5.2, 131, 9.3, 10.8, 5.6, 13, 10, 11.8, 20, and 23.6 years. Some of these may cancel each other out depending on the phases and amplitudes. And, some may be attenuated or amplified by the Earth’s actual thermal response, particularly the shorter period (higher frequency) ones ought to tend to be attenuated.
Most of these periods appear to describe the locations of major and minor peaks in the 20th century HADCRUT data within the resolution of the PSD. In particular, there is the ~65 year one, and what may be an average of the 20 and 23.6 year ones, which would resolve into two peaks with more data.
Thus, it is possible that the entire shooting match is the result of just two guns at 20 and 23.6 years, but more extensive analysis is needed.
========================================================================
Bart says
“Thus, it is possible that the entire shooting match is the result of just two guns at 20 and 23.6 years, but more extensive analysis is needed.”
I found your last sentence interesting BART. Could you elaborate.
Are you suggesting the HALE cycle ( mean of 20 and 23.6 = 21.8) is responsible for the 65.5 AMO/PDO as well? In fact ALL apparent frequencies
That would simplify things nicely.
—————————
I know what you mean BART. About losing track of past research. I have something to help you that l came across on TB WordPress a few months ago
but where is it. LOL
.
3 Hales = 60yr cycle. I remember TB telling me some thing about the sequence + – + of the solar cycles?>
The Hale solar cycles can be analysed in triplets.
I think the 3 Hales match the 60 yr global temp data nicely. I will try and find
I started a WordPress blog of my own for this reason. So l wouldn’t loose track of my investigations/research notes etc.LOL
I am slowly collecting my stuff from a range of blogs and forums and photo image hosting sites on into the same place for my sanity.
https://weathercycles.wordpress.com/
Maybe you need to make a blog BART
TB has a search engine . Try tying Bart or Hale etc
I will try to find the information on Hale triplets on TB’s blog.. when and if l can.
Also for CET data and analysis don’t forget xmetman ‘s excellent blog on CET data
http://xmetman.wordpress.com/
———————————————
RE Hale cycle In global record.
Found one of the diagrams l was looking for
Correction to my comments above
. 3 solar cycles = one phase (1/2)of the ~60 yr global temp’ cycle
1 1/2 Hale cycles = one phase (1/2)of the 60 yr global temp’ cycle
6 solar cycles = one ~60 yr cycle
3 hales = one ~60yr cycle
If solar cycles are longer or shorter than so is the 60 yr cycle
Global warming caused by the steeper gradient of the upward phase of the ~60 yr cycle
The phases are not symmetrical
1876-1917 ..A downward phase of the ~60 yr cycle = 41 yr
1917-1941 ..upward phase = 24 yrs
1941-1976 …downward phase= 35 yrs
1976-2000–upward phase = 24 yrs
Look at the SSC triplets forming the phases of the ~60 yr cycle in this diagram
https://picasaweb.google.com/110600540172511797362/SOLARSYSTEMAndClimate#6012456119389507794
1876-1917 ..A downward phase of the ~60 yr cycle = 41 yr ( declining solar cycle amplitude)
1917-1941 ..upward phase = 24 yrs ( increasing solar cycle amplitude)
1941-1976 …downward phase= 35 yrs ( slight decresing solar cycle amplitude)
1976-2000–upward phase = 24 yrs ( Increasing solar amplitude)
2000-2011 no net change in amplitude 2011 -~ 2022 ( strong declining solar amplitude.. Global cooling if this corelatoion is correct)
This means the 60 yr cycle length is determined by solar cycle ( 11 yr) triplets. The changing length determines the length of phasae of the quasi 60 yr cycle
The question begs
Why was 1876, 1917, 1941 ,1976 and 2000 points of temp’ change
What astronomical config?
THe change occurs every 3 SSC . The peak at max and min in the triplet SSC cycle
Why 3 SSC?
3 Solar cycles= ??
—————————-
Ah Ha . Tim has done some stuff on this
Look at those diagrams . Matches nicely
This shows the 6 SC = 1 ~60 yr
http://tallbloke.files.wordpress.com/2013/01/image-127.png?w=340&h=239
Nice post TChannon
awesome blog
——————————-
If the role of the solar system on the earths climate ( including the impact of the Hale Cycle) is to be resolved ,one has to strongly rely on cyclical analysis. The solar system is not a random chaotic phenomena but a coherent highly clockwork mechanism.
The earth ( its oceans/ atmosphere land( solid /liquid/gas)) is part of that mechanism and is not an island.
As the solar system has predictable behaviour based on physical constants. I believe the Earths climate responds in kind, in unity in resonance.
No element of the earths climate acts independently of the rest of the solar SYSTEM.
I contend correlations of planetary and solar cycles with earths climate are mandatory.
I expect our present future macro climate to be totally predictable .
The answers are already available in copious amounts of climate cycle studies but they are continually drowned out by the AGW mantra.
Many Scientists like Scaffetta have been derided and due respect to the integrity of cycle research is lacking. The IPCC fails to acknowledge the significance of natural cyclicity in the earths climate.
Ultimately l believe they will be embarrassed
——
slow sun /fast sun.. Nice find VUK…. 103 yr phases for each gear there VUK
and 2 phases is 206 yr being the DeVries cycle
solar gears.. sounds good. Does planetary torque induce gear behaviour?
~1913- 2010 ( your fast sun phas ) is actually 3 phases of the AMO/
The global temp inflection points have that phase at 96 yrs ( a short half phase of the devries)
(warming /cooling warming)
=9 schwabbe cycles (cycle 15-23_ ) = 4 1/2 Hale = half a deVries ( ~103)
https://picasaweb.google.com/110600540172511797362/SOLARSYSTEMAndClimate#6012899908094147762
Yes .
What causes the shift ?Shift In gears sounds good
Solar system torque no doubt?
What astronomical configuration was evident at Oct 2005? ( if that is the inflection point)
Maybe a change of mass on either ‘side’ of the sun . A see saw effect perhaps? A tipping point to shift torque vectors?
GEOFF SHARPE .
——————————————————————————————————
Went looking for what is causing the global temperature inflection points at the end of the Schwabe triplet cycle ( AMO/~60yr global temp cycle)
Went to Geoff’s site at Lancscheidt.wordpress to check out some planetary configuraions
Quite surprisingly found a lead quite quickly from the link above
I want to know what is causing the warming trend and then cooling trend cycle
What causes the sudden SWITCH in temp’ trends on a particular day/month/year
The AMO /global temp cycle a type of see -saw phenomena
Of interest was that in the AMO/ warming phase there are 2 alignments of JEV : one J + V with E opposing
Contrasted with in a cooling AMO phase there are 2 J + V with E op[posing to 1 JEV alignment
That would infer that for some reason a JEV alignment (in part?) produces a cooling affect on earth global temperature
How does a JEV alignment affect the Atlantic ocean to produce a cool phase? My first thought on that anyway
——————————————————————————————————-
quote Geoff
“The table is a plot of J+E+V alignments with each date corresponding with the green peaks on Desmoulins graph above. The odd cycle numbers are J+V with E opposing and even is J+E+V aligned. The G/O rule keeping mainly true. These alignments naturally include the Sun.
————————————————————————————————
responded
Posted this on Geof Sharpes
“schwabbe triplets = one phase of AMO / global temp indicator
—————————————————————————————-
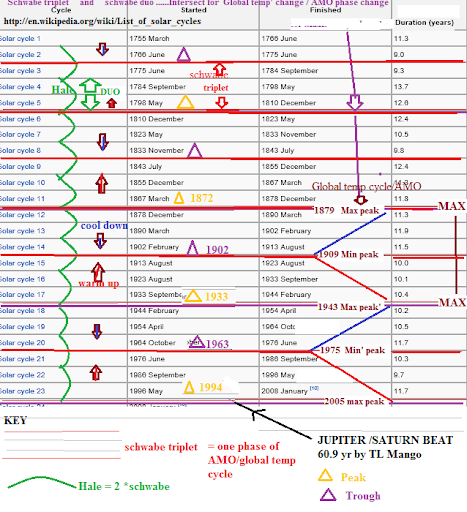
CYCLE TRIPLETS
12 , 13, 14 (Even odd even) = cool AMO ( Even dominant..JEV align)
15, 16,17 ( odd, even , odd) = warm AMO ( odd dominant.. J + V with E opposing)
18,19,20 ( even, odd, even) = cool AMO ( even dominant)
21,22, 23 ( odd,even,odd) = warm AMO ( odd dominant)
24,25,26 ( even,odd, even) = cold AMO ( global temp cooling trend)
Something about the alignments you have specified that correlates with the Quasi AMO 60 yr earth climate cycle
The shifts occur as a see saw between these 2 configurations .? some sort of switch ( inflection point involved) at specific point at the end of each triplet. some sort of tipping point in momentum?
instantaneous effect on global temperature with NO LAG
For some reason the even dominant triplet cools the global temp whilst ‘in play’
————————————————————————
Geoff has posted some alignments to make his case
Here is a sample for OCT 2010
and you can observe the configuration for every date from the source link her provided here
The Solar System Viewer can be seen at:
http://math-ed.com/Resources/GIS/Geometry_In_Space/java1/Temp/TLVisPOrbit.html
Note to self
The Schwabbe triplet cycle / AMO~60yr phase always ends at solar minima of a schwabe cycle
Just looking back at some notes l made when l first ‘cottoned on’ to the importance of the Schwabe triplets
Ian Wilson had completed a post on the planetary alignments of Jupiter, Venus, Earth and tidal bulge theory
source
——————————————————————————-
Ian.
May l ask if the EV alignment of 1.59866 yrs is a constant or can it vary?
l have seen the figure 1.5993 muted and a drift of 0.288
What causes the drift?
I have been searching through some of your figures as l am looking for key cyclic figures divisable by 3 and 6
As 3 SSN cycles = one phase of the AMO and 6 SSN cycles one cycle of the AMO
Your tidal bulge theory is important as the AMO is an ocean heat index correlated with sea level anomalies in the basin
Now l was very interested in a post you made above
where you have 360 VE alignments = 575.5176 yrs
Now is that an approximate given the drift?
should that read approximately equal to??
As a good lead between the AMO quasi cycle and your VE alignments and Jupiter torque
I am happy with these findings
1 VE alignment = 1.6 yr
7 VE alignments = 11.19 yrs ( mean ? of one SSC)
21 VE alignments = 33.57 years ( 3 SSC’s = one phase of AMO)
42 VE alignments = 67.14 yrs (6 SSC’s = 2 phases of AMO or one’ sine wave’ cycle)
Now as there are 360 alignments of VE in one Jupiter /VE torque cycle
(Convenient that there are 360 deg in a circle!)
360 / 7 VE alignments = 51.43
360 / 14 VE alignments = 102.86
51.43 perhaps 1/2 of the 102.86 Centennial cycle
14 VE alignments = One earth climate centennial cycle
The AMO or 67 .14 yr cycle mean fits into the 360 alignments in the cycle unevenly?
Hence l ask about drift?
360 alignments of the Jupiter /VE torque cycle divided by one phase of the AMO = 360/67.14= 5.362
360 / 42 VE alignments ( one AMO sine wave cycle)= 8.571
Now re: the AMO
I was looking for something that would change phase and change the’ torque’ on the ocean as the AMO goes positive and negative anomaly and this is related to sea level and consequently the temperature pattern in the Atlantic bowl/basin
Now you have provided that
You can see from my ratios above for VE alignments that l need ratios of the number 7
( 7, 21, 42) and l also need a phase change mechanism that you have provided and that is the cycle of zero to max torque at intervals that are factors of 7
Now your figures are close and have a strong multiple factor of 7 which l am looking for?
J/EVTorque cycle…………Factors of 7 plus drift?………..difference/drift?
71.9………………………….7. …70 ………………….71.9- 70 = 1.9
143.88……………………….14…..140…………………….143.88 – 140 = 3.88( ?)
215……………………………..21…..210………………….215 – 210 = 5
287………………………………28…..280………………… 287 – 280 = 7
359…………………………………35…….350…………….359 – 350 = 9
431……………………………………42……..420……………..431 – 420 = 11
503………………………………………49…….490…………….503 – 490 = 13
575.52…………………………………..56……..560…………….575.52 – 560 = 15.52
Notice the difference or drift shifts 2 yrs every phase of the torque cycle
I am not sure why l had to divide the factors by 10? ie: 7 * 10 , 14 * 10
What think l am proposing here Ian is that the AMO terrestrial cycle is in phase with your Jupiter /VE torque cycle some how by factor of 7?
There is a phase change in the AMO change 21 alignments of VE
21 alignments = 21 * 1.6 yr VE alignment = 33.6 yr AMO /global temp phase
Now in order for the connection to be set in concrete
The torque must switch every 21 alignments..
and the value of the VE alignment cycle must change in conjunction with the length of the SSC?
So the alignment period of VE is not a constant but varies?
I am trying to figure out why the torque from max to zero is 70 yrs
The AMO changes phase at half of that.. ..
Should go max /zero in ~33.5 years not 70 yrs
Something l don’t understand about torque ?
I need a torque shift change every 21 VE alignments . As the AMO alternates between positive and neg anomaly every 21 VE alignments approx 33.6 yrs
Now l say approximately as it is known the cycle length varies in length
That is why l ask .. Can the VE alignment shifts is length?
What VE/Jupiter configuration can shorten or lengthen the SSC .?
or what else can shorten or lengthen one VE alignment and consequently the length of the 11 yr solar cycle
—————————————————————–
IAN WILSON’s research
from Tallbloke search function
http://tallbloke.wordpress.com/?s=ian+wilson
———–
2012-2013 were very god years for Ian Wilson. Award wining stuff here!!
posted in order of date published on tallbloke
Fascinated by both what you are turning with all this research Crikey, …AND (far more so), on your application to delve/absorb the massive volumes of info you have churned through over the past 3 years.
For me, global weather trends have always been about the sun and other planetary influences. But I’m too lazy and uneducated to add credibility to my assertions like what you do.
You have taken this research to a new level altogether.
So much so, that I definitely regard you as a learned and credible observer of Earths long term climate history, and its potential future trends.
Petros
love this stuff. My favourite area of interest.
That’s a great google search string you found there Salvadore. so much there to read!
I noted this from your post salvadore
“The Gleissberg cycle is one of the slightly longer solar cycles, probably
modulating the Schwabe cycle (Wolf, 1862; Gleissberg, 1939).
Firstly assumed to have a duration of 88-years, Ogurtsov et al.
(2002) detected a characteristic split into a low-frequency band signal
of 50–80 years and a high-frequency signal between 90 and
140 years.
The indicates the major cycle is the ~ mean 60 yr ( 50-80 yr) and the 103 yr mean (90-140 yr)( one phase of the de vries ( 206 yr)
This is good
Building blocks
Mean lengths
11 ( schwabbe solar cycle)
22 ( Hale)
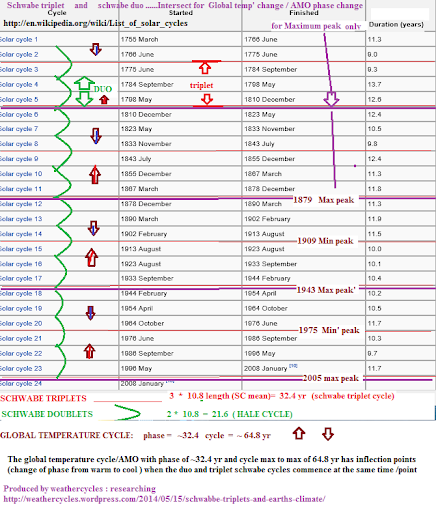
33 (schwabbe triplet) 3 * 11 =
66 ( AMO .= . 2 * schwabbe triplets) ( one phase of the AMO/mean 60 yr-66?)
88 Gleissburg mean? ( 4 Hales) ( 8 schwabes)
99 ( 3 lots of schwabbe triplets = 3 phase of the AMO/66) and ( 1/2 of De Vries )
198 ( De Vries mean ?)
176 YR = 2 * 88 ( mean GLEISSBURG)
ETC building into bigger cycles like Halstatt and longer
Need to put that on a diagram. to see (triangle?) with 11 as the apex
The basic building block of 11 is the mean.
If the solar cycle length varies than so do the longer cycles
For instance if solar cycle length is 10.3 + 9.7 + 11.7 = 31.7 ( a neg anomaly of 1.3) for the most recent schwabe triplet ( SC2, 23, 24)
——————————
Awesome find OB..quote:
“the last hibernation from 1793 to 1830′
‘The previous hibernation from 1615 to 1745′
1793 minus 1615 = 178-179 years = 1 Jose cycle = 9 Jupiter-Saturn conjunctions (178.73 years)
‘every 179 years as seen from the Sun, Jupiter and Saturn return to the same spot in the sky’
http://www.astronomycafe.net/qadir/q923.html
Ok so l thought the solar hibernations were De vries( ~200 yr episodes) . So maybe Jose minimums ?
Is the 179 years of the return to the same spot a constant time period . Or does this value vary?
This is good OB.Because you have found the start date of a major cycle. This is important for mapping and overlays.
1793.. What month and date?
and
1615 what month and date?
1793 + 179 yr = 1972( major climate shift mid 1970’s )
No minimum in1972 .. so must be another cycle overlaying . This minimum commenced between 1999-2005
( about 33yrs later )
Ha ha
1972 + 33 = 2005.. NICE!!
add on one more schwabe triplet to the JOSE for this minimum ( post 2005) to commence
Hey. Thanks for following Petros. !! Yes we first met on AWF 3 yrs ago when l first started delving. My haven’t we been through a lot since then.
We Left AWF and then went to weatherzone forum and then the commotion about AGW at weatherzone and subsequent gagging of climate discussion
Even WUWT has gagged the planetary influence on climate and call Tallblokes blog mystical to put it nicely
What a mistake they are making
Yes you are right there are some great headways developing
The thing that will frighten many is that there is insignificant lag between the shift in a Schwabe triplet phase and the global temp/ AMO ( atlantic multidecadl oscillation)
The change seems instantaneous at first glance.
I really appreciate your uplifting comments
The reason why the global temp link with Solar cycles has been quite weak on past analysis is that the analysis was based on linear trends with the solar cycle
If you group the solar cycles into triplets and know the starting number of the cycle andgo from there , the AMO cycle and global temp trends emerge nicely on the ~60 yr cycle
The longer upward trend since 1900 is probably the JOSE or de Vries overlaying. Will have to investigate that though
Don’t bag your self Petros. You are a worker andl am a full time ‘retired bum’ with time on my hands.LOL and cheers
SDP asked
“How close to a minimum phase are each of these solar cycles? How important are each of these cycles as a climate driver? Scale 0 =weak, 10= strong climate driver”
Qian and Lu 2010 have mapped 4 cycles

If you look at the time period around 2000 , they identify 4 cycles peaking at their maximum.
These cycles are in the range of
Hale ~22 yr , schwabbe triplets ~66yr, 116 yr ( ?) and the De Vries ~ 200
All 4 going down
This is how l interpret their cycle frequncy map
Their next minimum will be at 1/2 their full cycle length ,or one phase .In this case all these 4 cycle going down
Hale = 2002 + 11 = 2013 minimum
Scwabbe triplet = 1998 + 33 yr = ~ 2031 minimum ( AMO negative phase .. global cooling trend)
116 cycle? Not named .. = 1994 + 58 = 2052 minimum
DeVries = 1998 + 100 yr = 2098 minimum
—————————————
Now keep in mind that the schwabbe triplet cycle on its way up again from 2031 which would
temper the amplitude of the others still going down
Also tempering the cooli ng is another larger cycle curently going up which reached minimum back in 1700 Maunder period.
This will also temper the cooling trend
—————————————————————–
As for which is the stronger of the climate drivers
Looking at the modern temperature record. There are 2 obvious significant global temperature cycles
The AMO ~ 60-66 yr ( schwabbe triplet). Peaked max in 1998 according to Qian
and a longer cycle of the de Vries length that is clearly evident in All the 200 yr downturns ( as John Casey in nhis letter to Obama haswritten) as global temp’ drops like the dalton, sporer, maunder minimums
The warm phase of the de Vries = 1900-2000 warming
A longer cycle is evident on the picture l posted, which seems to overlay, which is longer . It had its Minimum at the Maunder and suspect it is 1400-1500 yr cycle .
Qian and lu have NOT overlayed this cycle.
Generally longer cycles seem to have larger effect on climate. Especially when the overlaying effect is highly constructive or destructive.
OB said
“Btw I haven’t ‘found’ it, it’s known as the Jose cycle.
I didn’t say you found it. I said
This is good OB. Because you have found the START DATE of a major cycle.
1793 and 1615 .
Commencement of solar hibernation . ( point where a number of cycles constructively align to produce a strong solar minimum event and global cooling)
What l think many won’t stomach, is that the lag in global temperature change from solar downturn in 1793 and 1615 were instantaneous. There was no lag..
From my observations. When a number of cycles overlay to amplify. Both pos or neg,, the temp change is instantaneous
The global warming period from 1900 -2000 is a good example of that
De Vries up phase (1900-2000) + (1970- 2000 AMO/scwabbe triplet) up phase = increased temperature gradient upward
from forum discussion
SDP asked
“How close to a minimum phase are each of these solar cycles? How important are each of these cycles as a climate driver? Scale 0 =weak, 10= strong climate driver”
Qian and Lu 2010 have mapped 4 cycles

If you look at the time period around 2000 , they identify 4 cycles peaking at their maximum.
These cycles are in the range of
Hale ~22 yr , schwabbe triplets ~66yr, 116 yr ( ?) and the De Vries ~ 200
All 4 going down
This is how l interpret their cycle frequncy map
Their next minimum will be at 1/2 their full cycle length ,or one phase .In this case all these 4 cycle going down
Hale = 2002 + 11 = 2013 minimum
Scwabbe triplet = 1998 + 33 yr = ~ 2031 minimum ( AMO negative phase .. global cooling trend)
116 cycle? Not named .. = 1994 + 58 = 2052 minimum
DeVries = 1998 + 100 yr = 2098 minimum
—————————————
Now keep in mind that the schwabbe triplet cycle on its way up again from 2031 which would
temper the amplitude of the others still going down
Also tempering the cooli ng is another larger cycle curently going up which reached minimum back in 1700 Maunder period.
This will also temper the cooling trend
—————————————————————–
As for which is the stronger of the climate drivers
Looking at the modern temperature record. There are 2 obvious significant global temperature cycles
The AMO ~ 60-66 yr ( schwabbe triplet). Peaked max in 1998 according to Qian
and a longer cycle of the de Vries length that is clearly evident in All the 200 yr downturns ( as John Casey in his letter to Obama has written) as global temp’ drops like the dalton, sporer, maunder minimums
The warm phase of the de Vries = 1900-2000 warming
A longer cycle is evident on the picture l posted, which seems to overlay, which is longer . It had its Minimum at the Maunder and suspect it is 1400-1500 yr cycle .
Qian and lu have NOT overlayed this cycle.
Generally longer cycles seem to have larger effect on climate. Especially when the overlaying effect is highly constructive or destructive.
For example
The climate driver strength of the scwabbe triplet/AMO is seen here
Look at the global temp cycle here


You can see the schwabbe triplet cycle / AMO ~60 yr. Notice the up phase is steeper than the down phase
Reason.. The De Vries is superimposed /overlayed on the up phase increasing the temperature gradient since 1900
whoops forgot to attach a link to the schwabe triplet and De vries largely controlling the global temperature
in our past 100 yrs.
source
http://forum.weatherzone.com.au/ubbthreads.php/topics/1189956/2
OH.. HAPPY DAYS!!!
A GREAT !! Finding here.
——————————————————————————–
A thought from OB lead me to investigate 18.6 yr lunar declination
————————————–
OB. You had me interested in your lunar data of 18.6 yr cycle.
so…
I thought l would check out the 18.6 yr lunar declination cycle against the global temp cycle
since 1900
I have plotted the 1/4 phases of the lunar cycle against global AMO/ schwabe temperature cycle
I used this data table from Bonny lee Hill
https://picasaweb.google.com/110600540172511797362/MOON#6015067228676912146
and plotted on ‘ surly bonds ‘ global temp’ inflection points
Some absolutely incredible results
The 18 .6 yr declination cycle is embedded into the global temp pattern and in synch +/- 2 yr with the schwabe/ AMO global temp cycle
This is awesome!!
1 3/4 (7/4) lunar declination cycles = One phase of the AMO/schwabe triplet cycle
Notice the sequence
Lunar.. midpoint 1 > minimum > midpoint 2 > Maximum and then repeats
You can also predict the next AMO minimum which is 1 3/4 Lunar declination cycles from Lunar Max 2006
which is Lunar midpoint 1 at 2038 +/- 2 yr
Look at THIS !!!
https://picasaweb.google.com/110600540172511797362/MOON#6015085432987035986
Ha Ha
AGW is dead . Its ALL cycles.. 100%. No temperature lag!
That means the lunar declination cycle is in synch? ‘ the with schwabbe triplets
and
the ~ AMO ~66 yr global temp cycle is in synch with them as well
as should be in a unified system
I hope the above diagrams explain the result..
A bit more info’ on how l found and mapped that correlation between the lunar declination cycle and the AMO/schwabe triplet /_66yr global temp cycle
Here is a table of the lunar declination cycle
I plotted all the dates for each 1/4 phase on to the global temp graph
https://picasaweb.google.com/110600540172511797362/MOON#6015102929587583506
If l had only mapped the max and min., l would have missed the finding
Note to self to pay attention to detail and not expect whole number correlations’
I marked the global temperature inflection points for the 33 yr cycle phases (AMO/schwabe triplet) with corresponding 1/4 phases of the lunar declination cycle
I noticed they sat well on the table of values . I marked those points with a maroon star.
I have then marked the up phase in global temp with a red line and the down phase in global temp with a blue line
I was then able to calculate the number of lunar declination quarters for each global temp phase
This turned out to be a consistent and uniform value of 7 quarter sections of the lunar declination cycle , which is 7 * 4.65 = 32.55 yr = schwabbe triplet = AMO phase = one phase of global temp cycle ( AMO) = 1 3/4 lunar declination cycles
Notice also the inflection points in global temp and the sequence of position on the lunar declination table
ITs is not in order but is a repeating pattern
Midpoint 1 > >>>>>>Minimum >>>>>>Midpoint 2 >>>>>> Maximum ..REPEAT Mid point 1 etc
One AMO phase is midpoint 1then Minimum
but the next AMO cycle is
Midpoint 2 then Maximum
Actually . It takes 1 1/2 AMO ( up,down, up from 1908-2006 )to make the full repeating pattern here and that is captured in the table l have drawn on
So that would be
from 1908 ( mid point 1) to 2006 ( maximum) = 21 quarter declination cycles = 21/4 = 5.25 lunar declination cycles in 3 phases of the AMO
5.25 * 18.6 = 97.65
Nice number
Tallbloke has a new post on SOLAR PERIODIC INSTABILITY
Thought l would investigate Vukcevics fast sun/ slow sun model and overlay what l have learnt about the schwabe triplet cycles and lunar declination
Vukcevic …fast/slow sun model
Firstly l wanted to brush up on solar cycle length
some notes
cycle 1-23 ( 1755-2008= 253 yrs of data)
————————–
shortest cycle :
9.0 yr (solar cycle 2…1766-1775 )
—————————
Longest cycle :
13.7 yr ( solar cycle 4 ….1784…1798 )
( but recent research has showed that the longest of these (1784–1799) seems actually to have been two cycles,[3][4)
solar cycles can be shorter than 9 yr?
http://en.wikipedia.org/wiki/Solar_Cycle_Length
—————————————————-
Range in lengths of schwabe cycle from 1755 – 2008 = 4.7 yr
max length – minimum length = 13.7yr – 9.0 yr = 4.7 yr
wikopedia say range in Schwabe length is 8 – 14yrs ?
so range in schwabe length on longer time scales is 8-14 yr = 6 yr
So if mean in solar cycle length is 10.8 yr. The anomaly range is
8……………10.8……………..14
10.8 +/- 3 yr.
The mean is also the median
————————-
source
from list of solar cycles wikopedia
http://en.wikipedia.org/wiki/Solar_Cycle_Length
—————————————————————————————————–
NOW to select the time period l want based on Vukcevic fast sun / slow sun and cycle time lines
THE RESULTS are GOOD
Fast sun has shorter schwabe cycle lengths and slow sun has longer schwabe cycle lengths
No surprise
But the NICE surprise is .The schwabe triplets and the lunar declination cycle l found in the last post fits snuggly +/- a couple of years
https://picasaweb.google.com/110600540172511797362/SOLARSYSTEMAndClimate#6015491995579189778
“oldbrew’ from Tallbloke got me thinking again with his wonderful links to stir the brain
I was reading this link OB posted
http://www.ips.gov.au/Educational/3/1/4
I noticed the writer Richard Thompson points out that there are double dips or deep troughs in the geomagnetic (aa) level at some cycles
So.. Thought l would se whetre they fall in the Schwabe triplet sequence
To my surprise there is a regularity with Double dips/ Maximums in 5/6 of the schwabe triplet cycles and they ALL are found in the FIRST schwabe cycle of the triplet
DOUBLE DIPS in the Schwabe Solar Cycle linked to the SCHWABE TRIPLET SEQUENCE
Here is the diagram which speaks for itself
Note that you can predict that it is highly likely that a double dip in the solar cycle 24 as solar cycle 24 is the start of a new schwabe triplet
NICE!!!!
https://picasaweb.google.com/110600540172511797362/TIMESERIESAndTrends#6015857263156992738
CYCLES RULE !!!
Thanks OB for another excellent lead.
Really appreciate . Your links have been very fruitful for my studies
———————
Some more amazing results after reading Ian wilsons post you recommended
link
http://astroclimateconnection.blogspot.com.au/2013/07/is-this-planetary-signature-in-our.html
Now Ian correlates a DUO schwabbe with the North pacific index
He had some nice years marked that delineated his cycles
He also noted embedding / nesting of cycles to produce the multiple larger cycle
He was able to show the correlation of Jupiter / Saturn conjunction/opposition within this cycle
—–
I thought l would take his duo schwabe cycle ( Hale) and overlay with the schwabe triplet cycle l have been researching .
The results are spectacular.!!
Where the duo and triplet schwabe cycles coincide at intervals of 6 schwabe . These points in time correlate definitively with the global temperature cycle (~ 32yr phase/cycle/AMO )
For example: the maximum peak in 2005-2008 of global temp is the starting point of a NEW DUO schwabe and a NEW TRIPLET schwabe cycle .
This point of common intersection ALWAYS occurs at the global temp/AMO ~66yr max peak
There is no doubt that the global temperature cycle is in resonance with the schwabe multiple nested cycle complex which is also in resonance with planetary dynamics.
Personally l am happily gobsmacked !
Take some time looking and understanding this
from link
https://picasaweb.google.com/110600540172511797362/TIMESERIESAndTrends#6016220607467163058
( here is the global temp cycle l marked on that table

by ‘surly bond’
thanks surly !.. http://forum.weatherzone.com.au/ubbthreads.php/topics/1189956/2 )
Ok.
Going to look at an apparent solar sunspot amplitude cycle evident in the time series
Could be the Gleisssburg cycle which is often coined at ~80-100 yr
Thanks to ‘Jim’ from tallbloke blog
for pointing that out
——————————————————————————————-
This amplitude cycle looks consistently in the order 10 schwabe cycles
mean 10 * 10.8 = 108 yr.
https://picasaweb.google.com/110600540172511797362/TIMESERIESAndTrends#6016583234843255026
What is evident in this cycle is the trough peak trough in solar amplitude ( an appearance of a hill)
over ~100 yr time period
In this case the range was 115 yrs from cycle 5-14 (1798-1913)
and 107 years from cycle 15-24(1913 – ~2019)
87 years (70–100 years): Gleissberg cycle, named after Wolfgang Gleißberg, is thought to be an amplitude modulation of the 11-year Schwabe Cycle (Sonnett and Finney, 1990),[30] Braun, et al., (2005).[31]
http://en.wikipedia.org/wiki/Solar_variation
If you were looking at planetary influences for the cause of this solar amplitude cycle. This diagram is useful for some possible start and end dates of the cycle
In relation to my study of the schwabe triplet cycle and now the duo ,trio and 10 schwabe cycle .
The 10 schwabe gleissburg commenced at the same time as the schwabe triplet in 1913
This was the base minimum of a schwabe triplet and also close to minimum in the ~66 yr global temp cycle in 1909
I feel the timing of this 100yr cycle can be correlated with global temp trends of the AMO/PDO type
There appears to be a likely connection with 4 phases of the AMO/PDO hence global temp’ constrained within the 100 yr solar amplitude cycle +/- 5 yr
I was interested in the dip in SC amplitude when the AMO reached a minimum in1975 .Also renowned as a point of climate shift
Posted this on TB’s blog. Some thoughts in response to David A’s thoughts
———————
I have seen evidence that their is no lag in global temp for the schwabe triplet cycle.( 3 * 10.8)
A Schwabe triplet is one phase of the AMO/PDO/global temp cycle.
I am talking about the phases of the global temperature cycle here ( the shorter ~33yr phases imbedded in longer term phases of 200 yr and longer)
Regardless of the amplitude of each schwabe in the triplet , the timing of global temp shift remains at the same point. …. at the end/minimum of EVERY 3rd schwabe
The global temperature oscillates, ALWAYS , at the point of the minimum trough of the last of the schwabe triplets.
There are inflection points in the global temperature ~66yr cycle.
There are inflection points in the milankovitch series as well
Saw tooth, a switch, a flip flop, bi polar temp see -saw, call it what you will
You can specify the month and year at which this inflection point occurs.
An inflection point is an abrupt shift in the other direction
How can this occur?
taking one of your points……”.a change in input.”
The only instantaneous cause and effect that l can think of that does not involve a lag of any kind is the Ideal gas laws
PV=nRT
Is the earth in a closed system?
Change the pressure on the planet . Drop or increase the temp of the stratosphere?
This would explain why more earth quakes in a cooling climate. As the stratosphere cools? the atmosphere shrinks changing volume and pressure and stresses on the solid component
If heat leaves to space the pressure drops..?
blah blah
What ever the cause. I am convinced the global temp’ shifts instantaneously at the end of every 3rd schwabbe.
and l am looking out for the cause
I have noted that the position of Jupiter/ Saturn and Uranus /Neptune couplets are correlated to the schwabe triplet cycle
Conjunction/ Opposition/Conjunction
or
Opposition/Conjunction/opposition
It is worthwhile considering if the density of the quadrants of the solar system affect the pressure on earth. ( miles Mathis)That is my first line of inquiry
cheers
Spent some time reading tallbloke on some longer cycles of th1,000- 2,000 variety
Learnt that Leif has a nice power spectra map of the sun spot for long time series
( thanks! paul vaughan for the link)
https://picasaweb.google.com/110600540172511797362/WavesAndHarmonics#6023212869537804018
source
Click to access Comment-Planetary-Peaks.pdf
you can see the mean sunspot cycle length at 10.8 yrs
and of interest is the last in the series of 1024 yrs
There appears to be a sort of linear pattern from about 50 yrs to 1024 yrs
and leif explains in his paper that their are multiples involved.
Not surprising as l noticed this much earlier in cycle studies( nesting/subsets/constructive amplification)
This gives weight to the notion of some sort of additive resonance or constructive amplification come post 50 yr according to leifs graph ?
Of interest is that this multiples of…. is not chaotic but ordered
Fractions of 1024 .. 1/1024, 2/1024, 3/1024 etc gives the peaks
——————————————————————————
Other reading was a jog over to Ian wilsons where he recommends his papers on the 1470 yr lunar cycle
http://astroclimateconnection.blogspot.com.au/2013/06/are-dansgaard-oeschger-d-o-warm-events.html
a time series picture l snapped here from his page
https://picasaweb.google.com/110600540172511797362/MOON#6023232044408073250
———————————————————————–
I wanted to know what the longest possible cycle was for one full rotation of the planets ( aligned to aligned)
Some googling yielded
The next ~planetary alignment is the year 2438 and the previous one is 500BC
That yields a solar system max cycle length of 1938 yrs
No how many mean solar cycle lengths fit into this period?
1938 ( one solar system cycle) / 10.8 ( mean solar cycle) = 179.44 (JOSE? Chandler wobble cycle?)
This means there are 179.44 solar cycles in one solar system cycle
————————————–
Leif from his power sunspot graph above has the maximum power peak/ max cycle at 1024 yrs
1938 Solar system cycle /2 = 969 ( half way )
969 is 55 yrs short of the 1024 maxpower peak in the sunspot number
So pretty much 1/2of the planetary solar system cycle is where the power peaks build in a semi linear fashion or as leif says in multiples 1/1024, 2/1024 etc
and the down side of the 1938 planetary cycle, there is only one power peak at 55 yr ( coincidently the same number point in his graph where the power peaks commence on the upslide)
I can’t find a planetary cycle longer than 1938 yrs?
Ian wilsons lunar 1470 cycle falls within the boundaries of the 1938yr planetary cycle
ratio.. 1.3
1938/184 =10.53
1938/369 =5.25
1938/554 = 3.49
5 ‘lunar’ phases + 46 yrs = (1/2 of planetary cycle) and (55yrs short of leifs 1024 sunspot power peak)
1938/739 = 2.62
1938/923 = 2.099
——half way through the planet cycle 969yr……………
sun spots power peaks finish here at 1024yr
)then they subside logarithmically eventually at the 200 yr ( de vries threshold) into 10,000yr))
1938/1107 = 1.75
1938/1291 = 1.5
1938/1475 = etc
1938/1659
1938/1843
1938/ 95 yr remain
Hi
Just posting my brain storm notes and discussion from tallbloke
——————————————–
Ok. Thanks TB .. Planetary cycles into millions of years is good.. This would incorporate the Milankovitch cycles easily.
However as to the SOLAR link to earths climate.. Leif in power spectra identifies a max power band at 1024 yr .. Nothing after that?? in the time series to 10,000 yr
This would indicate the planets can only influence the sun to the order of 1024 yr.
If this were true
The larger earth climate cycles like Halstatt and D/O Milankovitch etc would be caused by planetary/ galaxy? motion and maybe some strong amplification factors like volcanoes
What Leif was saying l believe, is that the max cycle that can be caused from solar sunspot contribution has a maximum limit at 1024 yr.. decaying into time ( 10,000yr) at a steady rate at the the 200yr de Vries frequency
So.. Solar sunspots correlations with earths climate can be out ruled past the 2,000 yr mark
————————————————————————–
———————————————–
A great finding by ‘TL MANGO’ posted on tallbloke and link below
and my response and notes
quote from Mango”The Jupiter/Saturn beat 60.94838271 has troughs at 1902, 1963 and 2024.
The AMO graph over at ‘notalotapeopleknowthat’, bottoms out at ~1914 and 1975.
This is also a delay of about 11 or 12 years. This is interesting.
————–
Yes this a great finding!
1902 is the start of cycle 14 ( last schwabe in a schwabe triplet). The global temp downward cycle completed at 1909 as a minimum in the global temp’ cycle.
That is a lag of 7 yrs between Jupiter /Saturn beat trough and global temp in inflection point at 1909
1963 /64 was also the commencement of the last schwabe in a schwabe triplet , with the minimum of the AMO ( global temp cycle) in 1975. That is a longer lag of 11yrs
2024 + 7-11 yr = AMO global temp’ minimum
=
No global warming upward cycle until at least 2031 +
Finally some planetary links to the schwabe triplets l am studying. Thanks
TJ Mango!!!!!!!!!!!!
This beat is certainly partially linked to the timing of the ~66yr AMO global temp cycle
I suspect another planetary variable overlay to account for the 7- 11 yr lag.
That’s my hunch
Importantly.. Does Jupiter /Saturn beat have peaks as well as troughs ?

—————
( source:Wikipedia list of solar cycles
and
schwabe triplet timing..PICTURE
)
and
—————-
FROM
Some more discussion going on at Tallbloke on global temp and cycles
what causes the basic ~11 yr repetitive beat and cycle of the Sun ( suns heart beat)
Some research uncovers the best explanation l have seen so far
———————————————–
Ian Wilson says
“But there is one climate actor with an 11 year clock—the Sun.
And what is driving this 11 year clock? (rhetorical question).
Aren’t we claiming that it is the planets!”
A google of what planets cause the heart beat of the sun,( the basic solar cycle of the sun) whose mean length is 10.8 yr
yields the answer
and
( haven’t read them yet but will tomorrow)
quote
“The 11.8 year period is very close to 11.86 years, the orbital period of Jupiter.
The 10 year period is very close to 9.93 years, half the synodic period of Jupiter and Saturn.
(Conjunction and opposition of these two planets are both effective tidally)”
——–
some simple arithmetic
11.86 ( orbital period of Jupiter) + 9.93 ( half the synodic period of Jupiter and Saturn) = 21.79 (HALE cycle??)
and the mean of these 2 planetary contributions to the suns activity
11.86 + 9.93 = 21.79
21.79 / 2 = the mean of the above which = 10.895 ( the basic heart beat of the sun , the solar cycle?)
posting this link from Talbloke because it looks a very useful read and will investigate
by Bart Leplae
from comments at
Click to access 4451_leplae5.pdf
Solar Cycle induced through Coriolis Effect
Bart Leplae 22-May-2011
Bartleplae @ hotmail.com
—————————
and another to read and investigate recommended by Nithandera (aka Ian Wilson)from the same tallbloke link
always great value
Click to access 4425_wilson1.pdf
———————–
more to read
and
http://tallbloke.wordpress.com/2013/02/20/a-remarkable-discovery-all-solar-system-periods-fit-the-fibonacci-series-and-the-golden-ratio/
http://www.vukcevic.talktalk.net/NFC7.htm
http://www.vukcevic.talktalk.net/4C-data.txt
http://astroclimateconnection.blogspot.com/2010/05/mechanism-for-amplifying-planetary.html
http://tallbloke.wordpress.com/2011/03/05/patrick-geryl-the-sun%e2%80%99s-eleven-year-magnetic-reversal/
TL MANGO says:
June 18, 2014 at 7:04 pm
from Mango”
The Jupiter/Saturn beat 60.94838271 has troughs at 1902, 1963 and 2024.
The AMO graph over at ‘notalotapeopleknowthat’, bottoms out at ~1914 and 1975.
This is also a delay of about 11 or 12 years. This is interesting..
……….
The 60.94838271 year ( J/S beat)cycle has peaks at 1872, 1933 and 1994.
Since the cycle was extracted from an equation, I was able to go back
2.5 million years to estimate the value to 3 decimal places (60.948).
This was accomplished by super-imposing the 61 year cycle over the equation
and adjusting the period.
Also I was able to narrow the last peak down to 1994.06 using another technique.
source
Just noting joNova and Dr David Evans have a research article in the public domain
I HAVE TAKEN THIS COMMENT
“To sum up, in the system whose input is TSI and whose output is temperature we have detected a notch filter whose transfer-function amplitude indicates that it cannot exist unless it is accompanied by a delay of several years.”
http://joannenova.com.au/2014/06/big-news-part-iii-the-notch-means-a-delay/
The reason..
There is a delay of 7-11 yrs from Jupiter/Saturn troughs ( see above post) and global minimum inflection points in the ~66yr global temp cycle
and seeing the same in the Jupiter/Saturn peak as well
This may be related to their notch delay theory
http://joannenova.com.au/2014/06/big-news-part-iii-the-notch-means-a-delay/
The Troughs and peaks in Jupiter /saturn 60.6yr beat cycle always occur at the minimum of a solar cycle and occur at the commencement of the 3rd schwabe of the schwabe triplet
Continuing from above
I have applied TL Mangos most excellent information about Jupiter /Saturn beat ( 60.9 yr)
and plotted the peaks and troughs per his posts ( found above ) ,onto the Schwabe triplets series l have been studying.
I am thrilled with the results .
The notion of the lag suggested by NOVA and DAVID appears to exist here.
Anyway, here is my findings
——————————————-
The Jupiter /Saturn 60.9 beat ( re: TLMango) is positioned regularly on the minimum of the commencement 3rd schwabe in each of the schwabe triplets.
There is a delay of a few years before global temp inflection point for max or min is reached.( in the quasi ~66yr global temp cycle)
——————————
When J/S beat is max(peak) , so is the global temp cycle approaching max( + 5-12 yrs later )
When the J/S beat is (trough), the global temperature cycle approaches minimum ( + 5-12 yrs later )
I have no doubt this J/S beat is a major component in the timing of the Schwabe triplet and quasi 66 yr global temperature cycle
——————————
FINDINGS
It may be useful to print off this tabulated data photo , to follow my points below
https://picasaweb.google.com/110600540172511797362/SCHWABETRIPLETS#6026582322047792642
—————————————
Schwabe triplets cross correlated with Jupiter/Saturn beat of 60.9 yr and global temp cycle of the order quasi 66yr
In summary
————–
Solar cycle number.. 9, 10 ,11 (triplet)
year 1872 AD… J/S beat max PEAK occurred in the 3rd triplet ( 5yrs into). Global temp’ inflection point at 1879 = 5 yr + lag
————————————————
SC 12,13,14 (triplet)
1902 AD.. J/S beat TROUGH occurred right on commencement of third schwabe in the triplet. Global temp’ inflection point a minimum at 1909 .
LAG = +7yrs
——————————————–
SC 15,16,17 ( triplet)
J/S beat MAX PEAK occurred 1933 right on the commencement of the third schwabe . Global temp inflection point at 1943.
LAG= +10 yrs
————————————————-
SC 18,19,20 ( triplet)
J/S beat MIN TROUGH occurred 1963 one year before the commencement of the third schwabe. Global inflection point occurred as a minimum in 1975.
LAG= +12 yr
——————————————
SC 21, 22,23 ( triplet )
J/S beat max peak occurs 1994. 2 years before the start of the 3rd schwabe. Global temp inflection point was 2005.
LAG = + 11 years
—————————————-
SC 24, 25, 26( triplet)
J/S beat Minimum peak occurs … near the start of the 3rd schwabe and global temp inflection point at minimum is some 5-12 yrs later
———————–
etc
————————
NOTICE..
When J/S beat is max(peak) , so is the global temp cycle approaching max( + 5-12 yrs later )
When the J/S beat is trough, the global temperature cycle approaches minimum ( + 5-12 yrs later )
I have no doubt this J/S beat is a major component in the timing of the Schwabe triplet and quasi 66 yr global temperature cycle
—————————————————————-
The positive lag of 5-12 yr from J/S to global temp inflection point could be the signal Jo Nova and Dr Davis are seeing in their signal processing analysis?
although they are suggesting 11-20 yr lag signal ?
I found there ‘paper’ far too long and wordy. They need to do a ‘twitter edit’
I did however find this statement interesting
HAVE TAKEN THIS COMMENT
quote
“To sum up, in the system whose input is TSI and whose output is temperature we have detected a notch filter whose transfer-function amplitude indicates that it cannot exist unless it is accompanied by a delay of several years.”
I am yet to understand the concept of a ‘notch filter’ and why a delay / lag is necessary
Something to do with ‘steps’ ? I do understand that. The global inflection point is a step/ switch. with a precise inflection point in time ( depending on how you sample the data of course)
—————————————————————————
I have to ask TL Mango.. What exactly is a J/S beat dynamically speaking ? What does the beat refer to?
any links to where l could understand this beat concept at the beginning level please
and thanks for your planetary link help!
What other planet/s could cause the 5-12 yr lag before the switch flip,flop changes the global temp’direction? regards
Here l have taken Vukcevics time series graph of the AMO ( Atlantic decadal oscillation) which closely follows global temperature and overlayed the Jupiter/Saturn beat of 60.9 yr ( thanks to TL Mango)
and you can see more clearly the 7-12 yr lag between peaks and troughs of the J/S beat and the inflection point in global temperature
HERE IS ANOTHER CONTRIBUTION TO THE TIMING AND FLIP FLOP OF THE AMO
————-
POSTED THIS AT GEOFF SHARPES PLACE
—————–
OK
from Geoff sharpes place ( found this a while ago and commented on his blog)
and posted
It would seem all planetary configs’ are involved
————————–
CYCLE TRIPLETS
12 , 13, 14 (Even odd even) = cool AMO ( Even dominant..JEV align)
15, 16,17 ( odd, even , odd) = warm AMO ( odd dominant.. J + V with E opposing)
18,19,20 ( even, odd, even) = cool AMO ( even dominant)
21,22, 23 ( odd,even,odd) = warm AMO ( odd dominant)
24,25,26 ( even,odd, even) = cold AMO ( global temp cooling trend)
Something about the alignments you have specified that correlates with the Quasi AMO 60 yr earth climate cycle
The shifts occur as a see saw between these 2 configurations .
instantaneous effect on global temperature with NO LAG
Link here
source from Geoff Sharpe
Solar cycle
The table is a plot of J+E+V alignments with each date corresponding with the green peaks on Desmoulins graph above. The odd cycle numbers are J+V with E opposing and even is J+E+V aligned. The G/O rule keeping mainly true. These alignments naturally include the Sun.
1790
JEV alignment corresponds to a cool phase of AMO and a phase of global cooling in the earths temperature
planet alignments map
The shifts occur as a see saw between these 2 configurations .? some sort of switch ( inflection point involved) at specific point at the end of each triplet. some sort of tipping point in momentum?
instantaneous effect on global temperature with NO LAG
For some reason the even dominant triplet cools the global temp whilst ‘in play’
Visualize Solar System at a given Epoch
http://math-ed.com/Resources/GIS/Geometry_In_Space/java1/Temp/TLVisPOrbit.html
—————
Talking about this here
BTW Roger Andrews. That is an excellent graph on ENSO vs SC!
Hope you post it again when TB starts his new ENSO thread
and a cop[y of that post at Geoff Sharps place l have also posted at my place here
with diagrams and tables as per the notes above
TL MANGO says:in reponse to a question l asked
June 19, 2014 at 10:06 pm
to ‘weathercycles’
I can’t speak about the significance of other J/S beats.
But… I believe the 60.9 beat is a full fledged solar cycle.
The Sun orbits the center of mass ~1.67 times in a 19.86 year synodic period.
So… the Sun averages a very irregular orbit of 11.862242 years.
The Sun does this dance with Jupiter, where it lags for 9.93 years and then it leads for 9.93 years.
The Sun accelerates and decelerates with alternating periods of 9.93 years.
11.86 x 9.93 (11.86 – 9.93) = 60.94838271
So… these are physical mechanisms within the Sun.
I have always suspected that this lag and lead that the Sun does with Jupiter is somehow
related to solar cycle length.
Discussion on solar cycles and ENSO at Tallbloke currently
TB said

WC: The data Roger A has used shows ENSO events don’t occur once the upswing of the solar cycle is under way, until it’s at around max. I’m not sure why?
Graph by Roger Andrews
—-My thoughts on the NON- ENSO signature at up phase of the solar cycle.
The first thing that comes to mind is the period in time when the atmosphere is not in phase with the ocean and does not ‘couple’.
Just like our current ENSO state now in 2012, 2013, 2014. . We have had neutral years as the up phase of solar is in progress.
We could predict that we will have La Nina or El Nino after solar maximum according to Andrews frequency distribution histagram
But this cycle 24 is unique. It is likely to have a double max solar peak as is the case at the start of every 3rd schwabe triplet when the ~66yr cycle reaches max and min
Also a long solar cycle predicted l believe. So maybe some more neutral years to come before we hit the downslope of solar cycle.
Some discussion on tallbloke about the role of lunar
some of my comments
Doug said.
” The 18.6 year cycle looks to be a subcycle of a larger cycle. 60 year?
The clockwork universe reveals itself one wheel at a time.”.
——————————————————
Yes Doug. Precision!!
14 quarters of a lunar declination cycle = one AMO
14 * 4.75 = 67 yr AMO/global temp cycle
https://picasaweb.google.com/110600540172511797362/MOON#6015085432987035986
If you divide the Lunar declination cycle into its 4 quarters ( Max, mid point, Min , mid point)
Each quarter is 18.9 / 4 = 4.75 yr
You will find there are 7 lunar declination quarters = one phase of the global temp cycle/ AMO
7 * 4.75 = 33.25 yr phase of the AMO/global temp cycle
14 * 4.75 = 67 yr AMO/global temp cycle
7 quarters of the lunar declination cycle also equal 3 schwabe cycles( schwabe triplet)
The lunar declination quarters at 7 increments AND the schwabe triplets are linked to inflection points in global temperature
Note the sequence in the time series at the inflection points is not as you might expect ( they are not in ‘order due to the 7 quarter increments)
midpoint 1
Minimum
midpoint 2
maximum
repeat
Some notes l made in relation to the incidence of volcanic activity and the 100 yr phase De vries downward phase
and the correlation with Vukcevics fast sun/slow sun cycle of 10 schwabes per phase
posted this here
————————————-
Amazing information about volcanoes Salvatore and GAIL. You have won me over.
I would love to plot your list of volcanoes Salvatore, superimposed on the DeVries cycle.
From what is being suggested you would expect to see more volcanoes on the downslope of the De Vries . What comes to mind is Vukcevics fast sun/slow sun findings.
The De Vries Down cycle is most likely the slow sun ( 100 yr phase ) which = 10 schwabbe cycles
1700 De Vries Min?
upslope ( fast sun)to
1800 De Vries Max?
downslope (slow sun)to
1900 De Vries Min ?
Upslope ( fast sun)to
2000 De Vries Max
downslope (slow sun)to
2100 De Vries Min
So slow sun 100 yr phase correlates with Increased Volcanic activity?
Could easily test that…
Discussion on tallbloke currently re: significant volcanoes vs sunspot number
I have taken the liberty to note another relationship with Vukcevics fast and slow sun solar model and Micheal Casati’s correlation study between significant volcanoes and the schwabe cycle
(Note: The fast and slow sun phases are 10 schwabes each phase )
————————–
Findings
There are significantly more volcanoes in the slow sun ( 10 * 11 yr schwabe = ~111 yr phase, than the fast sun ~111 yr phase
I have used Michele Casati’s data
http://michelecasati.altervista.org/significant-statistically-relationship-between-the-great-volcanic-eruptions-and-the-count-of-sunspots-from-1610-to-the-p.html
and in particular his graphed correlations
———————————————
Vukcevic’s fast sun/slow sun ( 10 schwabes each phase)
———————————-
Approx’ VOLCANIC CORRELATION for each phase of fast / slow sun
1600-1700 ….slow sun = 11 eruptions ( 10/11 at solar minimum)
1700-1810….. fast sun = 5 eruptions ( 4/5 at solar minimum)
1810 -1920…… slow sun = 12 eruptions ( 9/12 at solar minimum)
1920- 2000 — fast sun
(fast phase still underway.cycle 24 is the 9th schwabe out of 10 cycle phase.. 9 out of 10 schwabes complete)
= curently 6 eruptions ( 2 out of 6 at solar minimum)
—————–
As you can see. There are twice as many volcanoes in the slow sun phase and are far more likely to occur at solar minimum
The above results fit in nicely with Gail Coombs post
——————————————————————–
Possible correlation between solar and volcanic activity in a long-term scale
——————–
ABSTRACT
——————–
Volcanic activity on Earth is described by special annual indices available since 1500. These indices have been compared with annual sunspot numbers… Using 21-yr running averages a striking similarity between these two time series is clearly seen. Volcanic activity is generally lower in periods of prolonged maxima of solar activity and higher in periods of prolonged solar minima. There is also a similarity between the spectra of these two series in the long-period range. Main peakes are located in the same periods in both series (200-215 yr. 100-105 yr 80-90 yr)….
——————
http://adsabs.harvard.edu/full/2003ESASP.535..393S
I have asked Dr Nicola scaffeat to have a look at these findings
here ismy post on Tllbloke wordpress
My personal research on sunspots indicates the relationship between global temp and sunspots occurs in schwabbe triplets for the 66 yr cycle and schwabbes of 10 = 108 yr (re Vukcevics fast and slow sun phases )
https://picasaweb.google.com/110600540172511797362/SCHWABETRIPLETS#6026582322047792642
Current research draft
The relationship is linear/ in phase with global temp, if your select the correct point in time
The last group of schwabe triplets was cycle 21,22 and 23 ( global warming)
The inflection point in global temp change is governed by the end of the schwabe triplet.
and one of the connections with planetary
“The Jupiter /Saturn 60.9 beat is positioned regularly on the 3rd schwabe of the schwabe triplet. There is a delay of a few years before global temp inflection point for max or min is reached.
When J/S beat is max(peak) , so is the global temp cycle approaching max( +/- 5-12 yr)
When the J/S beat is (trough), the global temperature cycle approaches minimum ( +/- 5-12 yr)
I have no doubt this J/S beat is a major component in the timing of the Schwabe triplet and ~66 yr global temp’ cycle
We have started the next schwabe triplet ( cycle 24,25,26)
——————————————————————–
We are currently also on the last of the 10 schwabe set
https://picasaweb.google.com/110600540172511797362/SOLARSYSTEMAndClimate#6015491995579189778
————————–
I would love to see your calculations if plotted against the schwabe triplets( AMO /global temp cycle) and the schwabe tenplets( fast sun /slow sun)
If you have time Dr Scaffeta l would appreciate your review of my findings one day in the future
———————————————————————————————-
Old Brew from Tallbloke had an excellent finding
quote
OB
“weathercycles: ‘
Leif from his power sunspot graph above has the maximum power peak/ max cycle at 1024 yrs?’
Six Uranus-Neptune conjunctions = 1028.33 years average.(3085/3)
See also LOD thread (and Paul Vaughan’s reply)
“
DR SCAFFETA’S REPLY
weathercycles says: about Leif’s sunspot model
Syn. SSN = ABS(COS(π/10.81*t)*COS(π/1024*t)) (1)
Leif shows that such a function produces several peaks observed in the solar system and in the sun and associated planetary model
The problem is that then Leif concludes that such a finding would disprove the planetary theory.
Leif is very funny, as many readers of this blog knows.
Let us analyze Leif Model.
First, he uses a basic 10.81 period that actually is a beat harmonics between the 9.93 Jupiter-Saturn spring tide period and the 11.86 year Jupiter orbital period (taken from my papers):
2/(1/9.93+1/11.86)=10.81
He then uses a modulation of 1024 year.
And finally he uses the ABS function to generate its sub-harmonics.
What Leif did not explicitly note was that his chosen basic frequencies contain the planetary harmonics. For example, 60*17 =1020 etc.
So his model was artificially constructed to get the planetary harmonics.
But how is it possible to simulate the planetary harmonics using such a simple formula? The answer is that the solar system is highly synchronized and all planetary harmonic form a quasi-harmonic sequence.
See here for more details:
Scafetta, N., 2014. The complex planetary synchronization structure of the solar system. In the Special Issue “Pattern in solar variability, their planetary origin and terrestrial impacts”, Pattern Recognition in Physics 2, 1-19.
http://www.pattern-recogn-phys.net/2/1/2014/prp-2-1-2014.html
———————
SOURCE
What causes the basic schwabbe cycle the mean of which is 10.8 yr
A Scafetta analysis
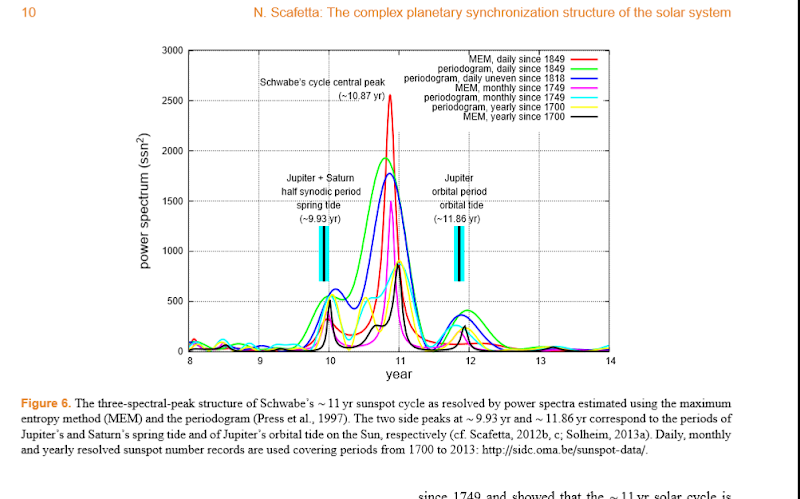
“Figure 6. The three-spectral-peak structure of Schwabe’s ∼11yr sunspot cycle as resolved by power spectra estimated using the maximum entropy method (MEM) and the periodogram (Press et al., 1997). The two side peaks at ∼9.93yr and ∼11.86yr correspond to the periods of Jupiter’s and Saturn’s spring tide and of Jupiter’s orbital tide on the Sun, respectively (cf. Scafetta, 2012b, c; Solheim, 2013a). Daily, monthly and yearly resolved sunspot number records are used covering periods from 1700 to 2013: http://sidc.oma.be/sunspot-data/.
”
source
The complex planetary synchronization structure of the solar system
N. Scafetta..2014
Click to access prp-2-1-2014.pdf
Tallbloke on what causes the basic schwabe cycle
Discussion here
———————————
TB says 30th July 2014
WC: You might find this post I made back in August 2011 helpful:
The 10.81yr period is not the Schwabe cycle length.
Nicola says in his 2012 paper that this is a fundamental internal oscillation period generated internally by the Sun.
I doubt it myself. I think it’s the outcome of the J-S relationship. As I wrote back then:
“This is in fact equivalent to Bart’s third formula for ‘necessarily apparent periods’; T1*T2/(T2+T1)
i.e. 23.72 (twice Jupiters orbital period) times 19.85 (the J-S synodic period) all divided by 23.72 plus 19.85, which equals 10.806.”
and
“Kepler’s third law states: The square of the orbital period of a planet is directly proportional to the cube of the semi-major axis of its orbit.
So for the orbits of Jupiter(11.86 years) and Saturn(29.46 years) we find that the squares (multiplication by itself) of the orbital periods are 140.67 and 867.3. The cube roots of these values are 5.2 and 9.54. The ratio of these values (one divided by the other) is 0.545. Jupiter’s orbit is a little over half the size of Saturn’s.
As Jupiter passes Saturn at conjunction it then takes just under 20 years for Jupiter to catch up with Saturn again. We can calculate this using a law discovered by Kepler’s mentor Copernicus:
The Synodic period is given by the inverse of the inverse of the orbital period of the slower moving body minus the inverse of the orbital period of the faster moving body:
Synodic period of Jupiter and Saturn is 1/(1/11.86 – 1/29.46)=19.852 years
We can then multiply that result by the orbital distance ratio of 0.545 we calculated to obtain 10.819″
——————–
WOW
Landcheidt and Jose ..on what causes the sun spot cycle
“Jose [1965] showed that the orbit of the Sun has an effect on sunspots and other phenomena on the Sun as did Landscheidt[1976]. Jose [1965] postulated that the orbit of the Sun caused sunspots. By postulating time derivative of the angular momentum of the curve the Sun’s orbit about the instantaneous center of curvature for the years 1616 to 2024. He showed that years up to 1963 correlated with sunspot cycle”
Evidence that the angular velocity of the Earth’s rotation is directly effected by the angular momentum of the Sun’s orbit is shown in Figure 2.
http://www.wxresearch.org/papers/orbit2004.htm
31st July 2014
Vukcevic has constructed the magnetic angle displacement of Jupiter and Saturn.
http://www.vukcevic.talktalk.net/J-S-a.htm
and discussed here
I noted that l could see his fast /slow sun model here which occurs in groups of 10 schwabes . Of note is that the angle displacement is higher during fast phase’ of the sun
Has the increasing angle displacement had a role in the increasing global temp’ since 1900??
https://picasaweb.google.com/110600540172511797362/SCHWABETRIPLETS#6042197015831829122
————————————-
Vukcevic also said
“Magnetic polarities + & – (read/blue periphery lines), HCS (white line) and a CME (multi-coloured moving magnetic cloud) are best observed from the middle animation in this link .
NASA’s statistical analysis shows that in the even solar cycles the sun’s originated MF’s north polarity leading edge is prevailing, while opposite is the case in the odd cycles.”
Animation
http://iswa.gsfc.nasa.gov/IswaSystemWebApp/iSWACygnetStreamer?timestamp=2038-01-23+00%3A44%3A00&window=-1&cygnetId=261
Following from Chatting to Tallbloke
TB says
“WC: THE 10.81 YEAR OSCILLATION IS NOT, REPEAT NOT, THE SCHWABE CYCLE LENGTH. Sorry to shout but you ignored this in my previous comment.
Nor is the phase relationship of J-S with the solar cycle constant. However there are patterns which indicate there is a strong relationship. For example, Vuk found this relationship between the angle dividing longitudes of J & S at solar minimum, as measured along the parker spiral (bottom plot)
TB
“Timo Niroma demonstrated that the average Schwabe cycle length of around 11.07 yrs is rarely seen in actual solar cycle length. They cluster most often near 10.38 and 11.9 years. These are JEV cycle and Jupiter orbital periodicities.”
Discussion here
Continuing discussion with Vukcevic re: fast sun / slow sun 10 schwabe amplitude cycle
————————
According to your model VUK…Fast sun phase ends at ~2020 with collapse of even cycle upward trend and regime shift into slow sun phase.
https://picasaweb.google.com/110600540172511797362/SCHWABETRIPLETS#6042197015831829122
We are in schwabe 9 of the 10 schwabe gear cycle
Slow sun 1gear 100 year commences ~2020 -2100
Noting from the volcano correlation post . The frequency of large volcanoes doubles in the slow sun phase. ( post 2020)
—————————–
I wonder if the sun has more than 2 gears?. As looking back into 1400-1600–1600-1700( little ice age), one might describe the solar gear speed as VERY slow and wonder if the sun has an even faster speed than fast..
Looking at this diagram ( zoom out)

Inferred above is a 1000 yr cycle ( 1,000 to 2,000AD max -max peak)
Possible nested cycles as far as as l certain currently
1 * 1,000 scwabes = 1,000 yr cycle
10 * 10 schwabes amplitude cycle = 1,000yr
3 (schwabe ) * 333.3′ = 1,000 yr
3 ( schwabe) / 10 schwabes = 3.33
1000 schwabes / 3 schwabes = 333.3
2 * 100 yr gear phase = 200 yr De Vries
1,000 / 200 De vries = 5
200 De Vries / 3 schwabbes = 66.6′
Milankovitch 100,000 / 1,000 yr cycle( ie: 1,000 -2,000AD) = 100
Some binary there above
1, 10, 100, 1,000 , 100,000
Interesting that all these major cycles/cogs end, terminate/collapse abruptly forming a saw tooth wave form. Including the suns speed gears
—————————————————————————————
Playing with Vukcevic Jupiter_saturn displacement angle at solar minimum
https://picasaweb.google.com/110600540172511797362/SCHWABETRIPLETS#6042564721954681090
No correlation between Solar cycle length and J _S angle at displacementat solar minima
Regime shift from slow to fast sun gear occurs in the middle of a Hale cycle ( on an odd cycle)?
Not sure if l have picked the correct point for termination of the slow phase ( 1913: end of cycle 14)
Wonder if there is a correlation between lowered /declining amplitude J-S angle displacement Hale cycles and increased global warming phase from 1900 -2005
and high amplitude cycling of the displacement angle… J-S 1800-1900 corelates with downward global temp cycle
Evidence of the climate shift of 1975 at the end of SC 20 when J_S displacement is at its lowest amplitude
https://picasaweb.google.com/110600540172511797362/TIMESERIESAndTrends#6015825479220392178
RE: the correlation with schwabe triplets..
Noted here
At the end of the slow phase ( end of cycle 14) in 1913 was also near the minimum of an AMO phase also the end of schwabe triplet( 12,13,14)
2008 is the end of cycle 23 , the end of schwabe triplet( 21,22, 23) and the commencement of the downward phase of the AMO
So there are some links
However the link to the 100 yr phases ( 200 yrDe Vries)of the global temp’ cycle are initially far more encouraging
———
Here I have marked the schwabe groupings on Scafetta (2014..http://www.sciencedirect.com/science/article/pii/S0378437114005226) to correlate with his calculated power peaks in global temp in the modern record
https://picasaweb.google.com/110600540172511797362/SCHWABETRIPLETS#6043635989249924818
Some pertinent figures posted by Oldbrew
“IW said:
61 years ____= 62.0085 years_______62.0085 years = 55 Full Moon Cycles = Perigee/Syzygy cycle
A 61-year period can also be derived from the motion of the J-S synodic in the solar system, using the degrees of angle quoted by Charvatova.
”
The schwabe triplet research predicted a double peak in this cycle
This happens and the start of the schwabe triplets
Great to see that this will be the case
( see post above somewhere. lol..aahh here
https://picasaweb.google.com/110600540172511797362/TIMESERIESAndTrends#6015857263156992738)
6th August 2014
Noticed a 3 yr Global temp cycle with an ~18 month phasein this graph
by

So wanted to
Overlay the above graph with the schwabe and hale cycles
————-
Result
———–
https://picasaweb.google.com/110600540172511797362/SCHWABETRIPLETS#6044429623622453010
NOTES
———
Here is a zoom in of global temp(land_ocean) showing cyclical behaviour.
from climatedatablog.wordpress
Eyeball estimate 3 yr full cycle max-max and ~ 18 month phases
…ENSO?
Have cross correlated this with the solar cycles as per ‘list of solar cycles_wikopedia
I have also marked the Jupiter _Saturn beat peak at 1994
and the HALE cycle across schwabe no.22 and 23
Points of interest
————————
-schwabe 22 = 3 peaks , 2 troughs ( during first phase of HALE cycle) and length is 9.7 yr
-Jupiter Saturn beat trough 1994 occurs 2 yrs before the end of schwabe 22 and 14 yrs before the end of schwabe triplet
-schwabe 23 = 3 peaks and 3 troughs ( during 2nd phase of the bi polar HALE cycle) cycle length was 11.7 yr
-The end of the schwabe triplet terminates at the trough of a ~3 yr max to max cycle
– THe shorter schwabe: no 22 , produced a higher frequency temp’ oscillation?
-The longer schwabe: no 23, in the 2nd half of the cycle produced longer frequency temp oscillations ?
Noting however that the 3 max peaks were preserved in the long and short cycle!! interesting
Does solar cycle length determine the frequency of global temperature oscillation ?
and
if a ~3 yr global temp cycle and a ~ 62.4 temp cycle
62.4 / 3 = 20.8
20.8 ..global temp’ oscillations in one AMO/ ~62 yr global cycle
Scafetta has a power peak at 20.8
Hale’s observations revealed that the solar cycle is a magnetic cycle with an average duration of 22 years
——————————————————————————————————-
caveat
( this data shows global peaks and troughs that are different from what l have used in nthe past. Maybe differnt technique?)
THe max peak on my previous global temp graphs have been max at 2005 and min in 1975
so ..caution..
Fascinating. Try http://www.solarsystemscope.com/ it’s very easy.
Hi Bob . You are only the second person to comment or take any notice. Your positive comment Encourages me..
Thanks for your comment and link
That link is excellent!
I have had it running backward for 15 mins and l amalready up to the year 1178 AD..
I am hoping in the future to match the spatial pattern of the planets for key climatic events. That resource will prove useful..Thanks.
However the planetary orbital periods may only be able to explain some of the earths smaller cycles. ( maybe up to 1000 yr) but l am not sure
Pluto orbital period.is as short as .247.68 years
Wondering whether our position in the milky way may be far more crucial in the longer cycles?
re: larger cycles such as Milankovitch cycles.
For example what causes the De vries cycle and the larger millennial cycle
Not sure if orbital period can explain…
My astronomy knowledge is limited so l have a step learning curve ahead.
I will just plod along
Do you have your own web page?
cheers
You’re welcome. Solarsystemscope is a great tool, or “toy” as you say. I see you over at TB’s place – you’re doing well. The Talkshoppers are way ahead of everyone. As for me, yes, I’m working on my own website that’ll be up soon, called “electricweatherdotcom”, with a focus on the sun-earth weather-climate connection. Love your curiousity and mental explorations.
Excellent your own website.. !
I find having your own place is great for storing photos, drafting and developing research and if your lucky a chance to discuss it. A great hobby and the chance to apply for research funding. You can link to twitter of course which is great by l do that on my other Christian blog.
The human memory can be poor and l constantly find myself having to search my findings from years ago to refresh.. and don’t forget to back up our work!!
Good luck and feel free to advertise your site on this blog..
cheers
A little interesting aside here
Bob WEBER posted above and gave me a nice toy to play with for my studies and yes l have been playing
http://www.solarsystemscope.com/
as a warm up exercise
I wanted to know what the configuration of the planets were like around the time of Jesus Birth
Now my first problem was that we don’t have an agreed date
re the star of Bethlehem and the shepherds etc
http://didyouknow.org/christmas/jesus/
Hmm ..so l spent a few hrs looking at configurations between 6BC and 6 AD
Then l had a thought.. In my studies with the Tallbloke crew, l have learnt about PHI and order in the Universe , the golden section and spiral etc
https://picasaweb.google.com/110600540172511797362/FIBONACCI_GoldenNumbers#
so l thought to my self
IF this was a major event in GOD’s timetable . HE would put on a special display of the planets for the event of the birth of HIS SON in the flesh to earth..
I looked for a cross pattern but only found a T shape
Then Bingo , the light went on..I thought l saw a spriral
so here it is from outer pluto in descending order to mercury and finally the sun.
THis configuration occurred ~ 28th October 2 BC
So l will add to the theories of the date of the birth of the SON of GOD
What would a GOD do to herald in the savior of the world than to stamp the solar system with the mark/stamp of the creator.. PHI/ golden numbers .. Food for thought..
—————–
As was filing my photo in my PHI picture folder , l noticed in my photos an example of this spiral formation in the solar system/heliosphere…. PHI and the PHI spiral.. see pic’ below
(Apologies for losing the source of the image below )
https://picasaweb.google.com/110600540172511797362/FIBONACCI_GoldenNumbers#6044763612532216658
It is called an an equiangular spiral, containing within apparently, triangle, square , hexagon.
A curious match/similarity ? with my find of the 28th October 2BC l thought!!
I will leave the mathematicians to determine that
source
https://picasaweb.google.com/110600540172511797362/FIBONACCI_GoldenNumbers#5911892482159311186
——————
Thanks BOB.. I am enjoying this toy!!
——————
Now , I expect Tallbloke to blog this finding at Christ..mass time for a fun/serious post..
LIke
How many times does the spiral config? emerge since 2BC- 2014?
cheers