CLICK ON THE TITLE TO LOAD ALL FURTHER ENTRIES BELOW
The ENSO season ( Nina / Nino ) is noted in the southern hemisphere as an Autumn to Autumn sequence.
The start of autumn in the southern hemisphere is March. All eyes to the ENSO indicators .
PLEASE CLICK ON THE TITLE TO LOAD FURTHER COMMENTS ON THIS POST WHICH APPEAR AT THE BASE OF THIS PAGE
There is currently plenty of media from the academics noting the climate modelling is suggesting an El Nino of sorts for 2014. Most evidence presented as been some warm anomalies in the south west pacific ocean
It is thought that Kelvin waves are pushing this sub surface warm anomaly toward the central and east pacific
Some are touting anomalies of plus 6 deg c
However this map below posted by Mike Hauber forum member of WZ forum is indicating anomalies of plus 2 deg c near the date line
You can follow this discussion here
http://forum.weatherzone.com.au/ubbthreads.php/topics/1251416/16
There are many other indicators of an El Nino apart from sub surface pacific temperatures / upwelling and downwelling
For this post we will start with a snap of the current sub surface temperatures across the pacific equator
The warm anomaly is clearly seen east of the dateline in the central pacific
This is not a surface anomaly map
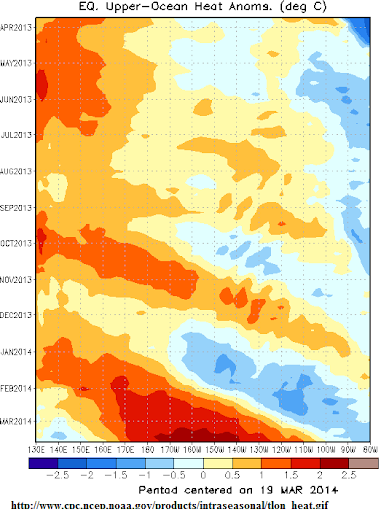
source
http://www.cpc.ncep.noaa.gov/products/

Outstanding information here. Recommended reading ..
Thanks to Bob tisdale for the link
Click to access enso_evolution-status-fcsts-web.pdf
Models going for neutral in spring a moderate El Nino in Australian summer
Looking at the indicators separately one wonders why the models have spat this out and l would say the sub surface trends and kelvin waves hold a large weighting
Interesting that the ONI index is currently at minus -0.7 , actually within the La nina threshold value.
Just to keep their options open. The percentage chance of an El Nino developing is currently ranked at 50:50 . At those odds l wouldn’t place my bets
A peak in the upper ocean heat content in the equatorial central Pacific?
or will it go higher?
http://www.cpc.ncep.noaa.gov/products/analysis_monitoring/enso_update/
BOB TISDALE
has graphed the comparisons of previous El Nino events with the current status
This graph shows the comparison

http://bobtisdale.files.wordpress.com/2014/04/figure-11.png?w=640&h=428
source
The ONI (Oceanic Nino index) has been neutral or La Nina is since April 2010
You would think we are due for a change..
The last index reading ( 3 month running mean) was neg -0.7 which is in the La Nina range. That should be colored blue as is their definition?
source
http://www.cpc.ncep.noaa.gov/products/analysis_monitoring/ensostuff/ensoyears.shtml
BOB TISDALE
NINO 3.34 SST Anomalies
http://bobtisdale.files.wordpress.com/
Current wind anomalies are trending El Nino
with increased westerly wind more so in the west Pacific
http://www.cpc.ncep.noaa.gov./products/analysis_monitoring/enso_update/
El Nino drying weather pattern has disappeared, scientists say
5th June 2014
http://www.weeklytimesnow.com.au/news/national/el-nino-drying-weather-pattern-has-disappeared-scientists-say/story-fnkfnspy-1226944360026
An explanation of the current El NINO forecast by Michael Ventrice
and posted on Jeff masters ‘wunderblog’
source
http://www.wunderground.com/blog/JeffMasters/comment.html?entrynum=2694
Worth a read for sure.! Some nice diagrams and explanations for this prediction of El Nino by the US Autumn/ Australian spring
Figure 1. A time-longitude plot of the departure from average of the depth of the 20°C isotherm shows the impressive nature of this downwelling oceanic Kelvin wave at the end of May, which had finally completed its trip all the way to the eastern Pacific Ocean. The series of these waves like has been observed in 2013 – 2014 is very typical of what one sees before the onset of an El Niño event. Note that since the downwelling oceanic Kelvin wave has emerged at the surface in recent weeks, we have seen a rise in the standard ENSO 3.4 index to anomalies approaching +0.5°C, which is the threshold for classification of El Niño conditions. Image credit: NOAA/CPC.
Figure 3. Departure of ocean temperature from average along the Equator in the Pacific Ocean on May 28, 2014 (top), shows an area of 5°C (8°F) ocean temperature anomalies at a depth of 50 – 150 meters, the signature of an oceanic Kelvin wave. In addition, warmer than average sea-surface temperatures extend along the Equator from South America all the way to the Date Line. This is a classic “Full-basin” El Niño expression
TIME LAPSE
http://www.cpc.ncep.noaa.gov/products/analysis_monitoring/enso_update/wkxzteq.shtml
There is potential for a big MJO event this month ( linked to westerly wind bursts)
Over the past month, the MJO signature was relatively weak. During the latter half of May, we observed a period of enhanced trade flow (easterlies) over the eastern half of the Pacific Basin, which can often counter, or “stall” the El Niño for a period of time due to favoring a period of upwelling in the eastern part of the Basin. But while the atmosphere favored a weakening of the El Niño expression, the ocean did not a skip a beat. Warm ocean currents continue to rip towards the east, advecting warm waters from the western half of the basin to the east. The Pacific Warm Pool, which was well established in the western half of the basin for the past couple of years, has now shifted past the Date Line. You can watch the remarkable evolution of the eastward shifting Warm Pool on the Climate Prediction Center (CPC)’s link here.
ANIMATION
http://www.cpc.ncep.noaa.gov/products/analysis_monitoring/enso_update/wkxzteq.shtml
Forecast models continue to show the peak of the El Niño will occur later this Fall, with a magnitude near +1.5°C above average, as defined by the ENSO 3.4 Index
BOB TISDALE
quote
“Without more westerly wind bursts and a weakening of the trade winds in the western equatorial Pacific, the warm water in the eastern equatorial Pacific will continue to decline, and we could very possibly have another ENSO-neutral year.”
Comment from LOCKE on weatherzone forum
http://forum.weatherzone.com.au/ubbthreads.php/topics/1270723/33
regarding the sub surface temps 2nd July 2014
” Very interesting situation and not what I would have predicted several months back. We could in fact be looking at a monster La Nina instead of the “super nino” being talked about in the media so much earlier in the year.”
Gee what a turn around
OFFICIAL DOWNGRADE
http://www.slate.com/blogs/future_tense/2014/07/17/el_ni_o_2014_forecast_it_s_now_looking_weaker_but_that_s_not_all_good_news.html
AUSTRALIAN RAINFALL MAY-JULY INDICATIVE OF A PROGRESSING EL NINO
ENSO ..NEUTRAL CONDITIONS CONTINUE
http://xmetman.wordpress.com/2014/10/24/enso-neutral-conditions-continue/
A graph from BOB TISDALES place

source and discussion
Tropical Pacific Ocean moves closer to El Niño
Issued on Tuesday 18 November 2014 | Product Code IDCKGEWW00
The Pacific Ocean has shown some renewed signs of El Niño development in recent weeks. Above-average temperatures in the tropical Pacific Ocean have warmed further in the past fortnight, while the Southern Oscillation Index (SOI) has generally been in excess of El Niño thresholds for the past three months. Climate models suggest current conditions will either persist or strengthen. These factors mean the Bureau’s ENSO Tracker Status has been upgraded from WATCH to ALERT level, indicating at least a 70% chance of El Niño occurring.
Not all indicators have shifted towards El Niño. Tropical cloudiness near the Date Line and trade wind strength are close to average, suggesting the atmosphere is still not firmly linked with the warmer ocean below. However, trade winds have weakened several times over the past few months and SOI values have remained generally negative, suggesting at least some atmospheric response to the underlying ocean conditions.
International climate models expect the warm tropical Pacific Ocean temperatures to persist, with most models predicting values will remain near or beyond El Niño thresholds for the next two to three months. Regardless of whether or not El Niño fully develops, warmer-than-average tropical Pacific Ocean temperatures, combined with cooler waters currently to the north of Australia increase the chance of some El Niño-like impacts. For many parts of Australia, this suggests below average rainfall and above average temperatures in the months ahead (as shown by the November–January Climate Outlook).
http://www.bom.gov.au/climate/enso/
NOVEMBER 2014
source
Big rainfall in Clifornia is sometimes a sign of el Ni no conditions
quote from XMETMAN
” I have for San Francisco now stands at 253.4 mm (up to 0600 UTC this morning) or a whopping 9.98″ of rain in just 16 days, and thankfully I notice that some of that has made its way to place like Fresno and Bakersfield.”
http://xmetman.wordpress.com/2014/12/16/it-pours-man-it-pours/
http://en.wikipedia.org/wiki/Effects_of_the_El_Ni%C3%B1o%E2%80%93Southern_Oscillation_in_the_United_States